Graylog
I am setting up a new syslog server at work and I decided that Graylog would work well for us. We are a medium sized non-profit and this is the first syslog server that they have ever implemented. I have setup Graylog in a test environment before, but it has been several years. I am writing this blog post so that I will have documentation for myself. I might also save a copy of just the instructions so that there is documentation at work.
I used Docker Compose to install Graylog so I don’t feel like there is a need to document the installation. I just cloned the Graylog repository, modified the docker-compose.yml file and the .env file, and then ran the Docker compose up command. I also like to use a reverse proxy to access my services so I added the entry for GraylogIP:9000. This allows me to go to graylog.wellslabs.org instead of using the IP address.
Dashboard
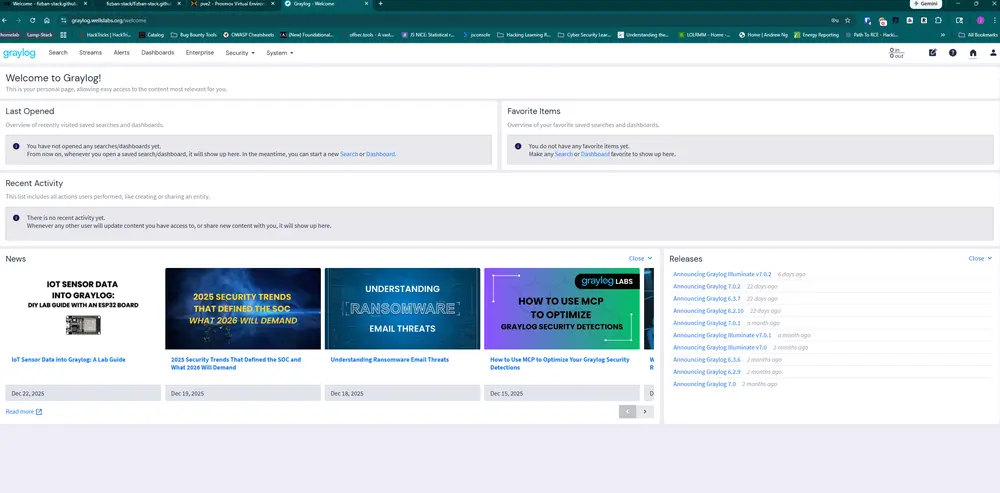
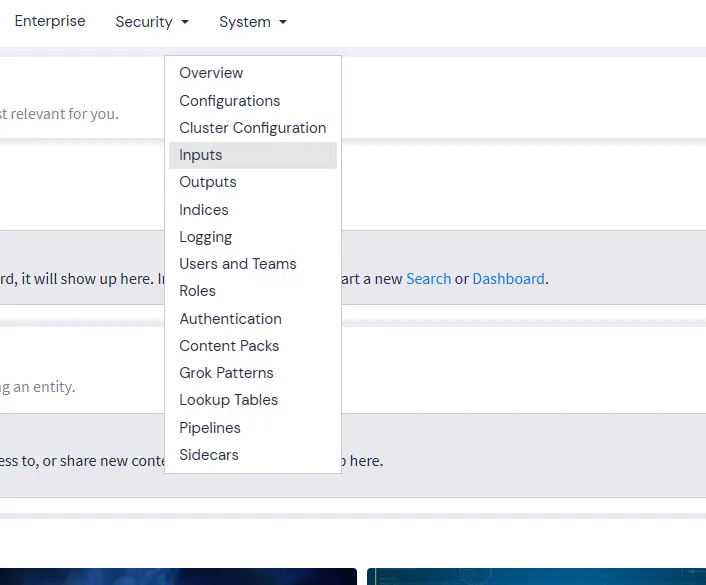
After opening, you are presented with a basic dashboard. It will have more to see here once we get some logs ingested and setup a couple of dashboards. To add a new input, go to System/Inputs.
Syslog Input
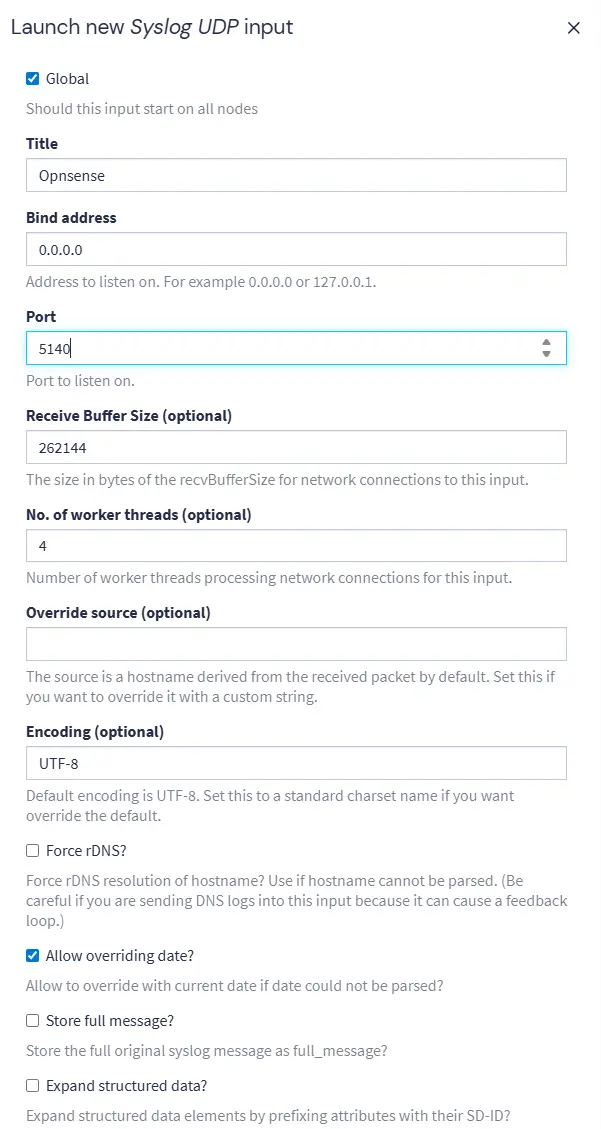
The first service that I am going to add to Graylog is the syslogs from my Opnsense. One of the main reasons that I am doing this at work is because the new Cisco Meraki firewall will drop log entries constantly. On the Input page, select Syslog UDP from the drop-down menu and click the Launch New Input button. The only entries that we need to change on this screen are the Title and the Port number that Syslog will use. Keep in mind that deploying Graylog in Docker means that we have to ensure ports we are using are present in the Docker Compose file or traffic won’t make it into our docker container.
Once we launch our new input, we will be back on the Inputs screen. Even though we just created that input, it is not active yet. We need to select Set-up Input.
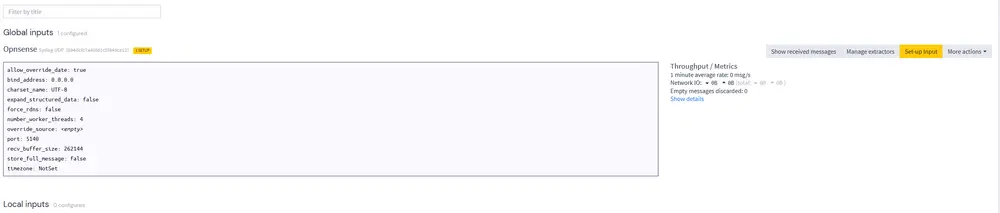
Syslog Stream
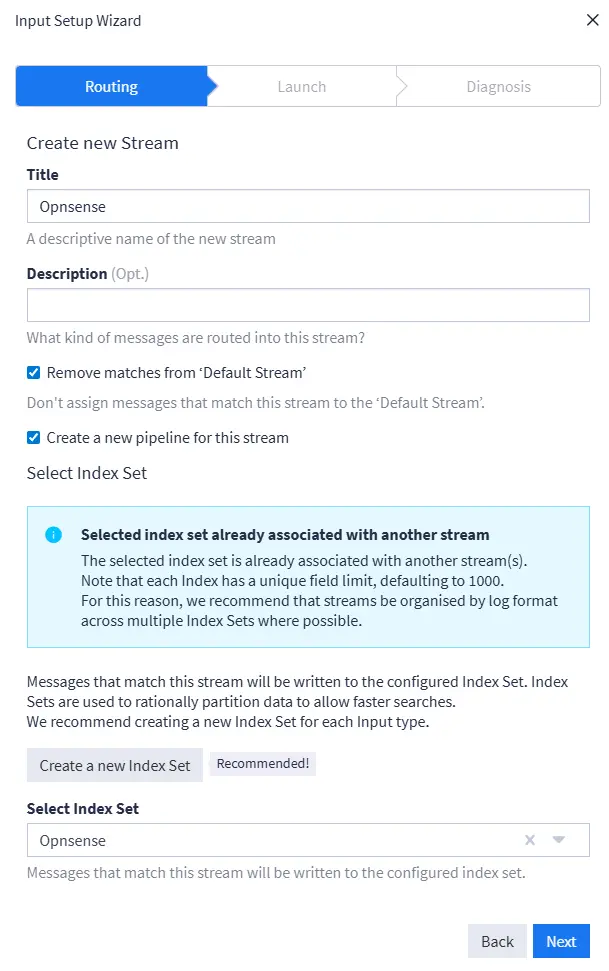
The first step is to setup the Stream that our new input will use. It is recommended that you create a different Stream for each input. This allows you to use Extractors on your logs later. We will enter the information in for our new Stream and also create a new Index for use with Opnsense.
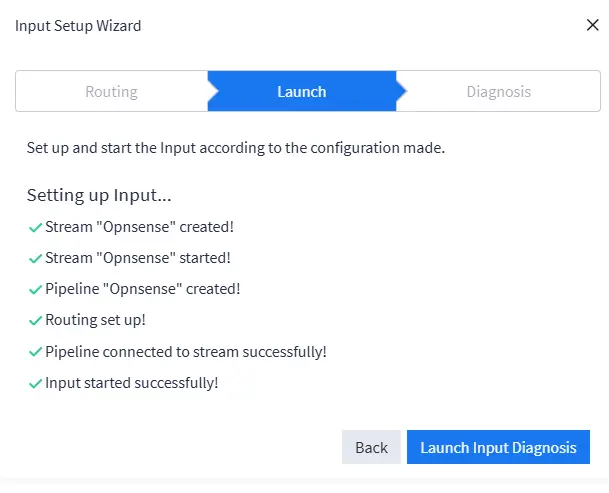
The next page allows us to launch the Input and then it performs a group of tests to ensure that the input is working. There are also diagnostics for when you have a troublesome input that you need help troubleshooting. All of our tests were successful so we can click the X and close this window.
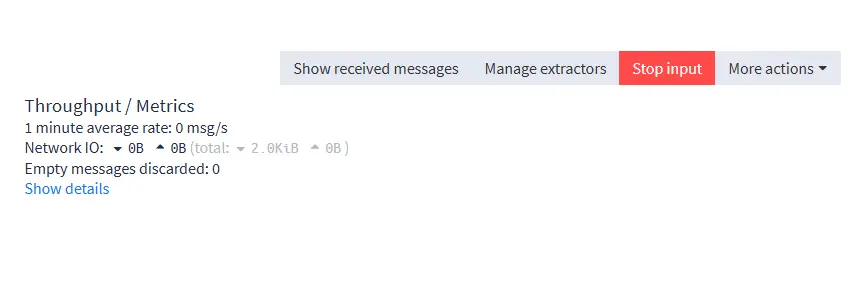
To ensure Graylog is receiving logs wait a minute until you see that network traffic has been received on that input. At this point, we have logs ingested into Graylog and if our only purpose was to create a centralized Syslog repository, we are done.
Extractors
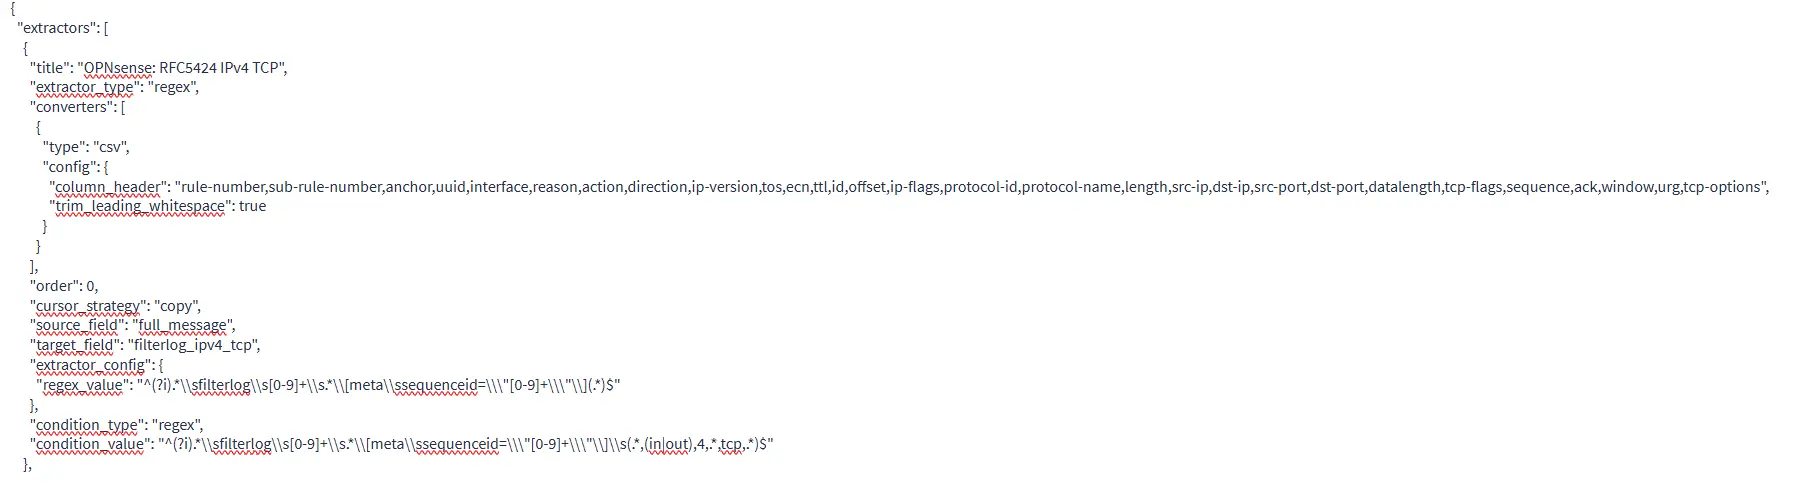
If we want to create more complex extractors and dashboards, the next step is to click the Manage Extractors button. In the extractors, I am going to import and extractor that I modified from the Graylog Marketplace. The extractor config basically tells Graylog what it should be extracting from the log and how to format that data.
Update - GeoIP
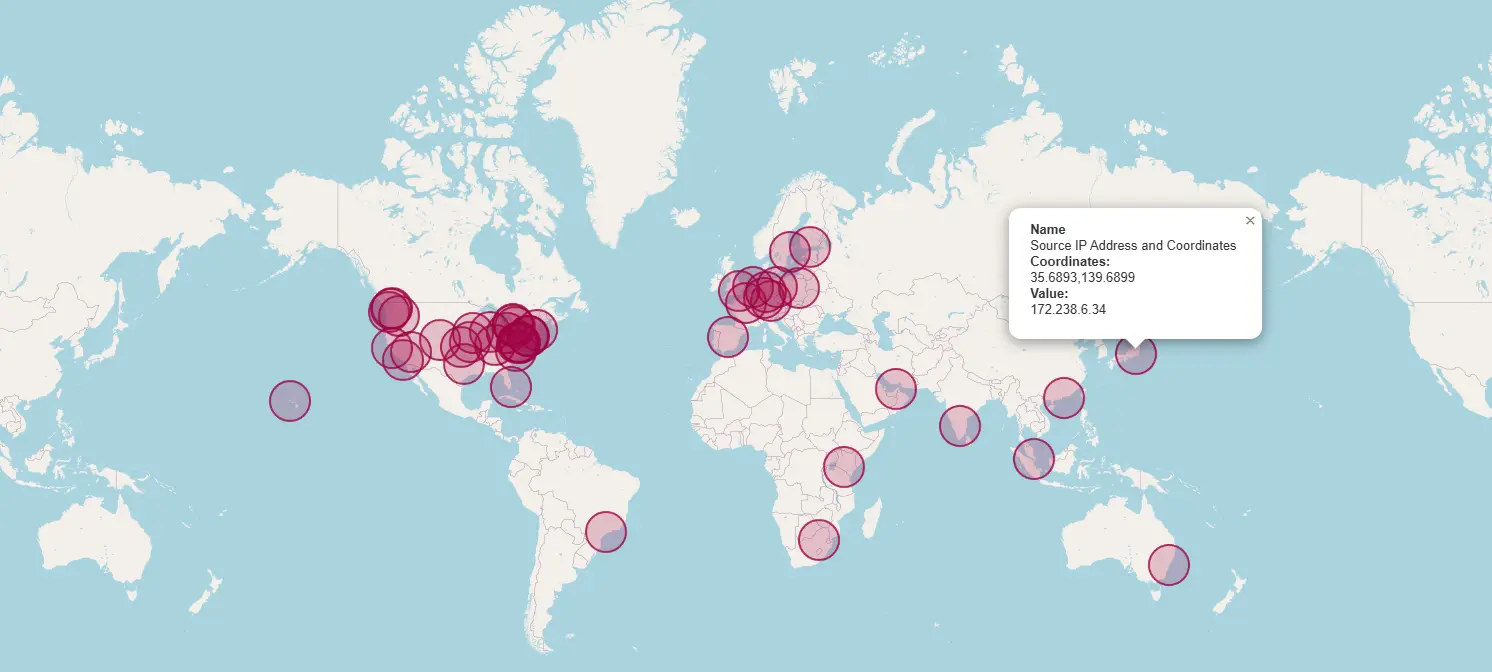
The GeoIP plugin for Graylog is one of the coolest thing I have seen for a dashboard. After downloading the Max Mind city and ASN databases, only requires a free account, you can build a dashboard that show geographically were your network is being connect to from and where your network is connecting to.