Velociraptor
Velociraptor is an open-source endpoint visibility and digital forensics tool built for incident response. It gives you the ability to dig into what is happening on endpoints across your environment by collecting artifacts, hunting for indicators of compromise, and monitoring activity in real time. Think of it as a way to ask very specific questions about what a machine has done, is doing, or has had done to it, and getting detailed answers back fast.
What makes Velociraptor stand out is the Velociraptor Query Language (VQL). It lets you write custom queries to pull exactly the data you need from endpoints. There is also a large library of built-in artifacts that cover everything from process listings and network connections to browser history and event log analysis. Whether you are responding to an incident or proactively hunting, Velociraptor gives you the depth and flexibility to get the job done.
Creating an MSI Collector
To get Velociraptor onto a target machine, you can create an MSI collector package from the server. This packages up the Velociraptor client with your server’s configuration baked in, so when it runs on the target it automatically connects back to your server.
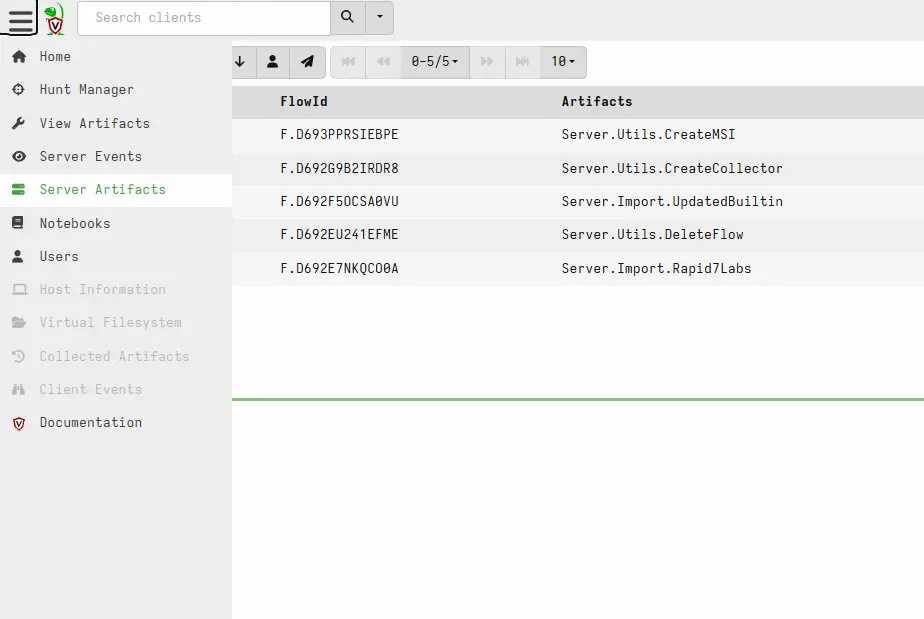
Start by navigating to the Server Artifacts screen and selecting the option to create an offline collector.
From here you configure the collector settings. You can choose which artifacts to collect and set the output format.
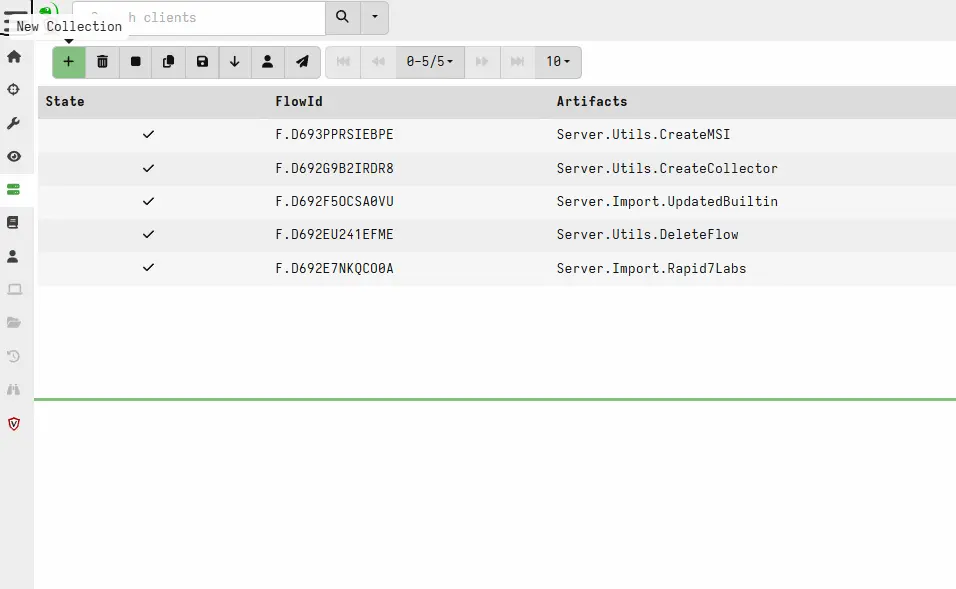
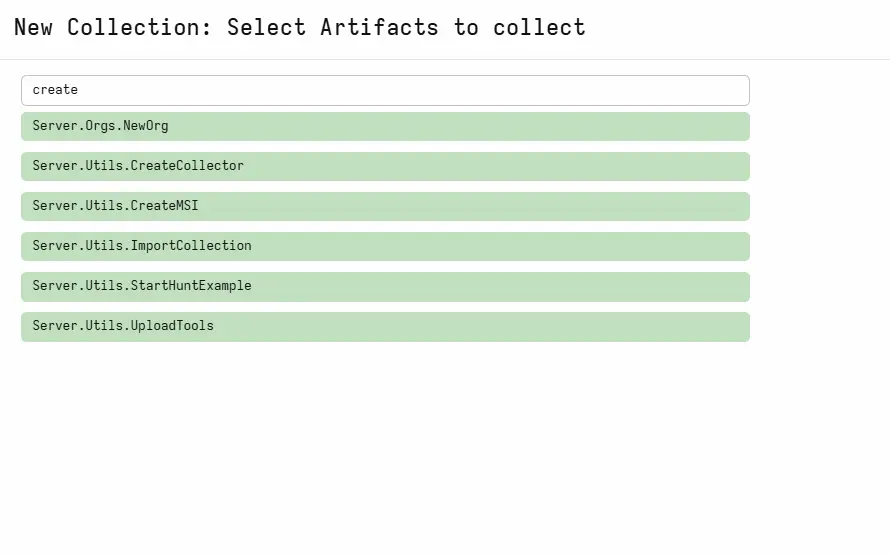
Then select MSI as the output type so it can be easily deployed on Windows machines.
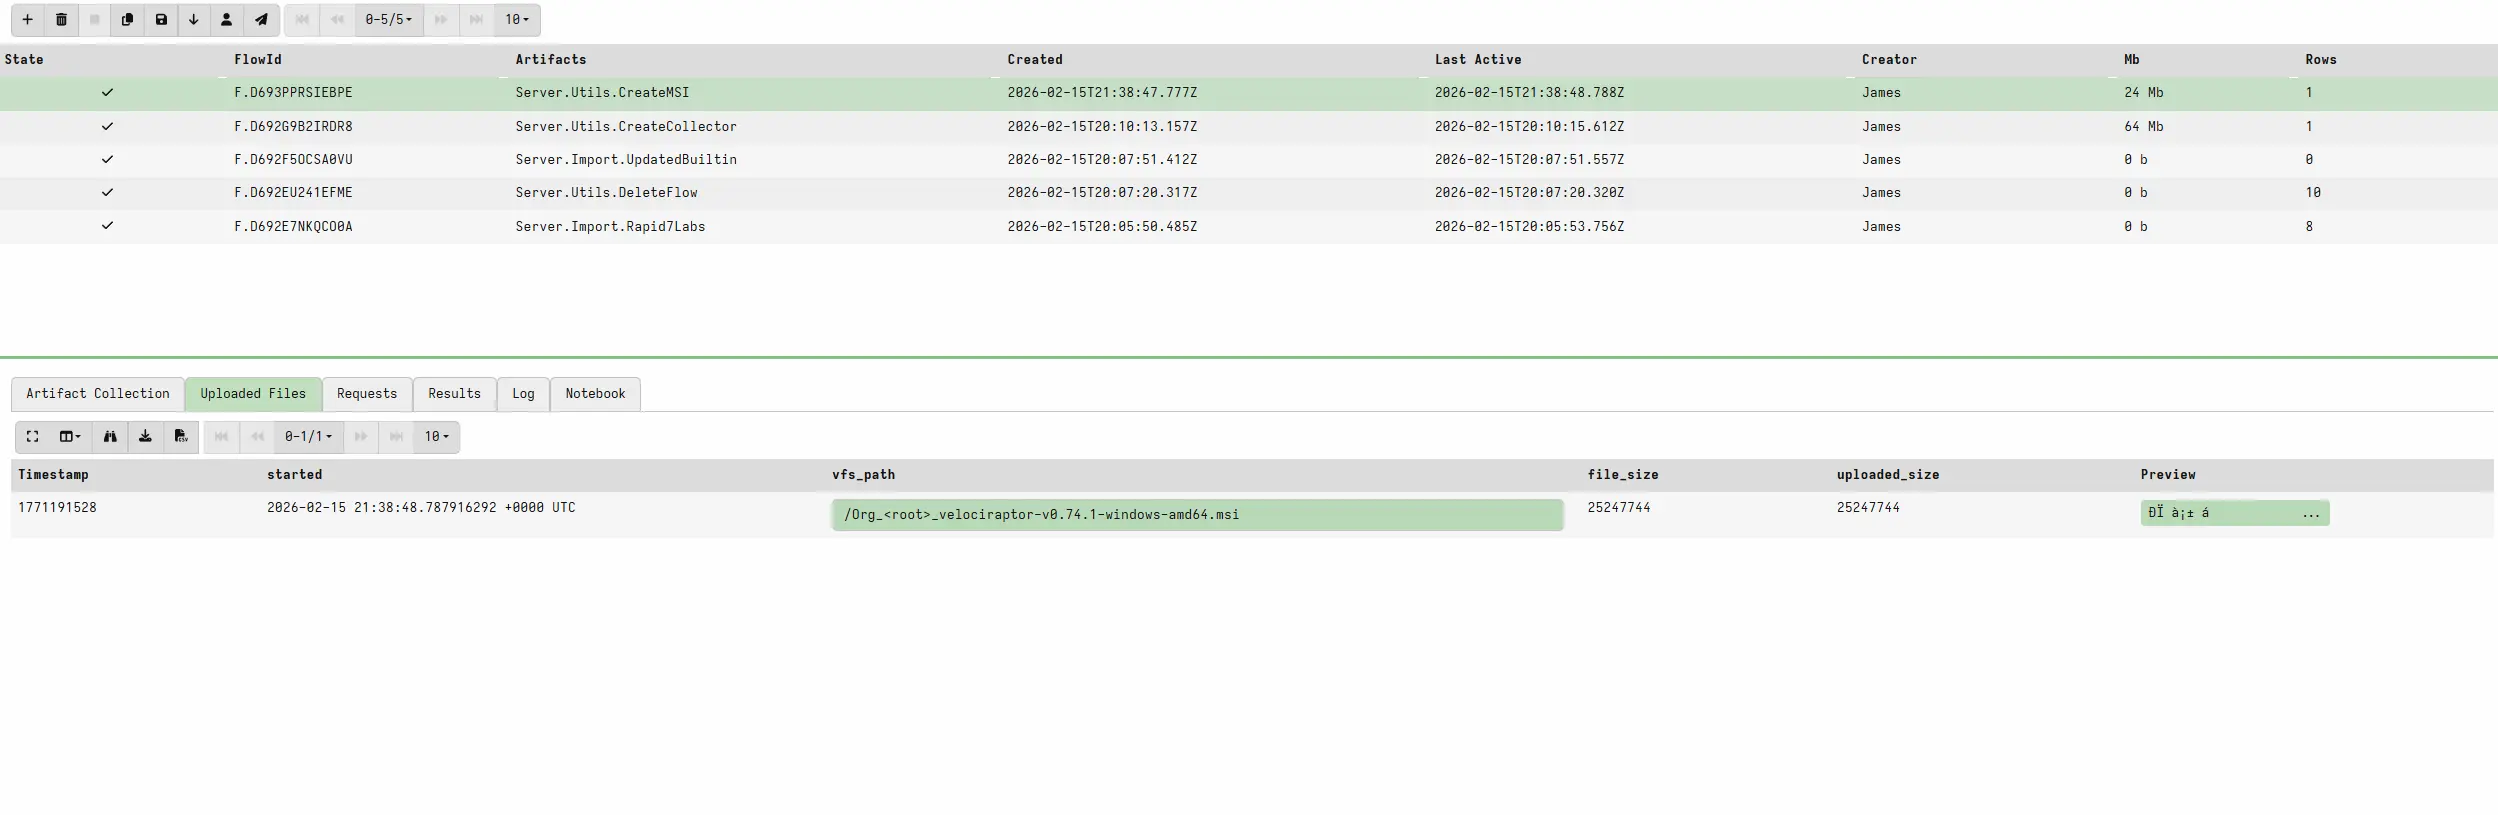
Once the build completes, you have an MSI file ready to deploy.
Getting the Collector to the Host
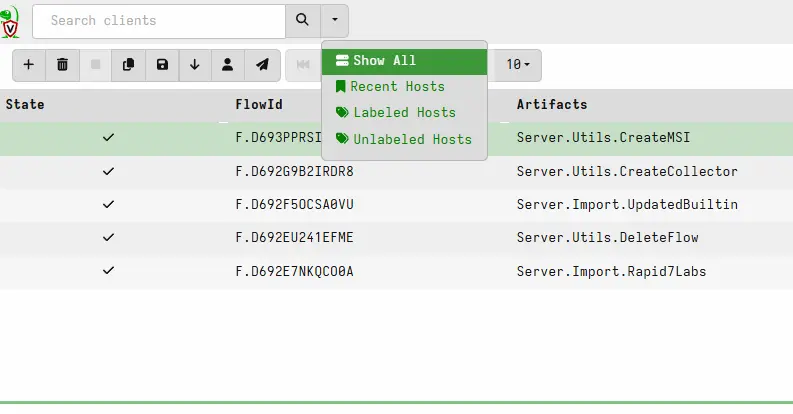
After transferring and running the MSI on the target machine, the Velociraptor client installs and phones home to your server. You can verify the connection by checking the host information in the Velociraptor console.

The main dashboard shows all connected hosts and their status. From here you can select any host to start digging into it.
Virtual File System
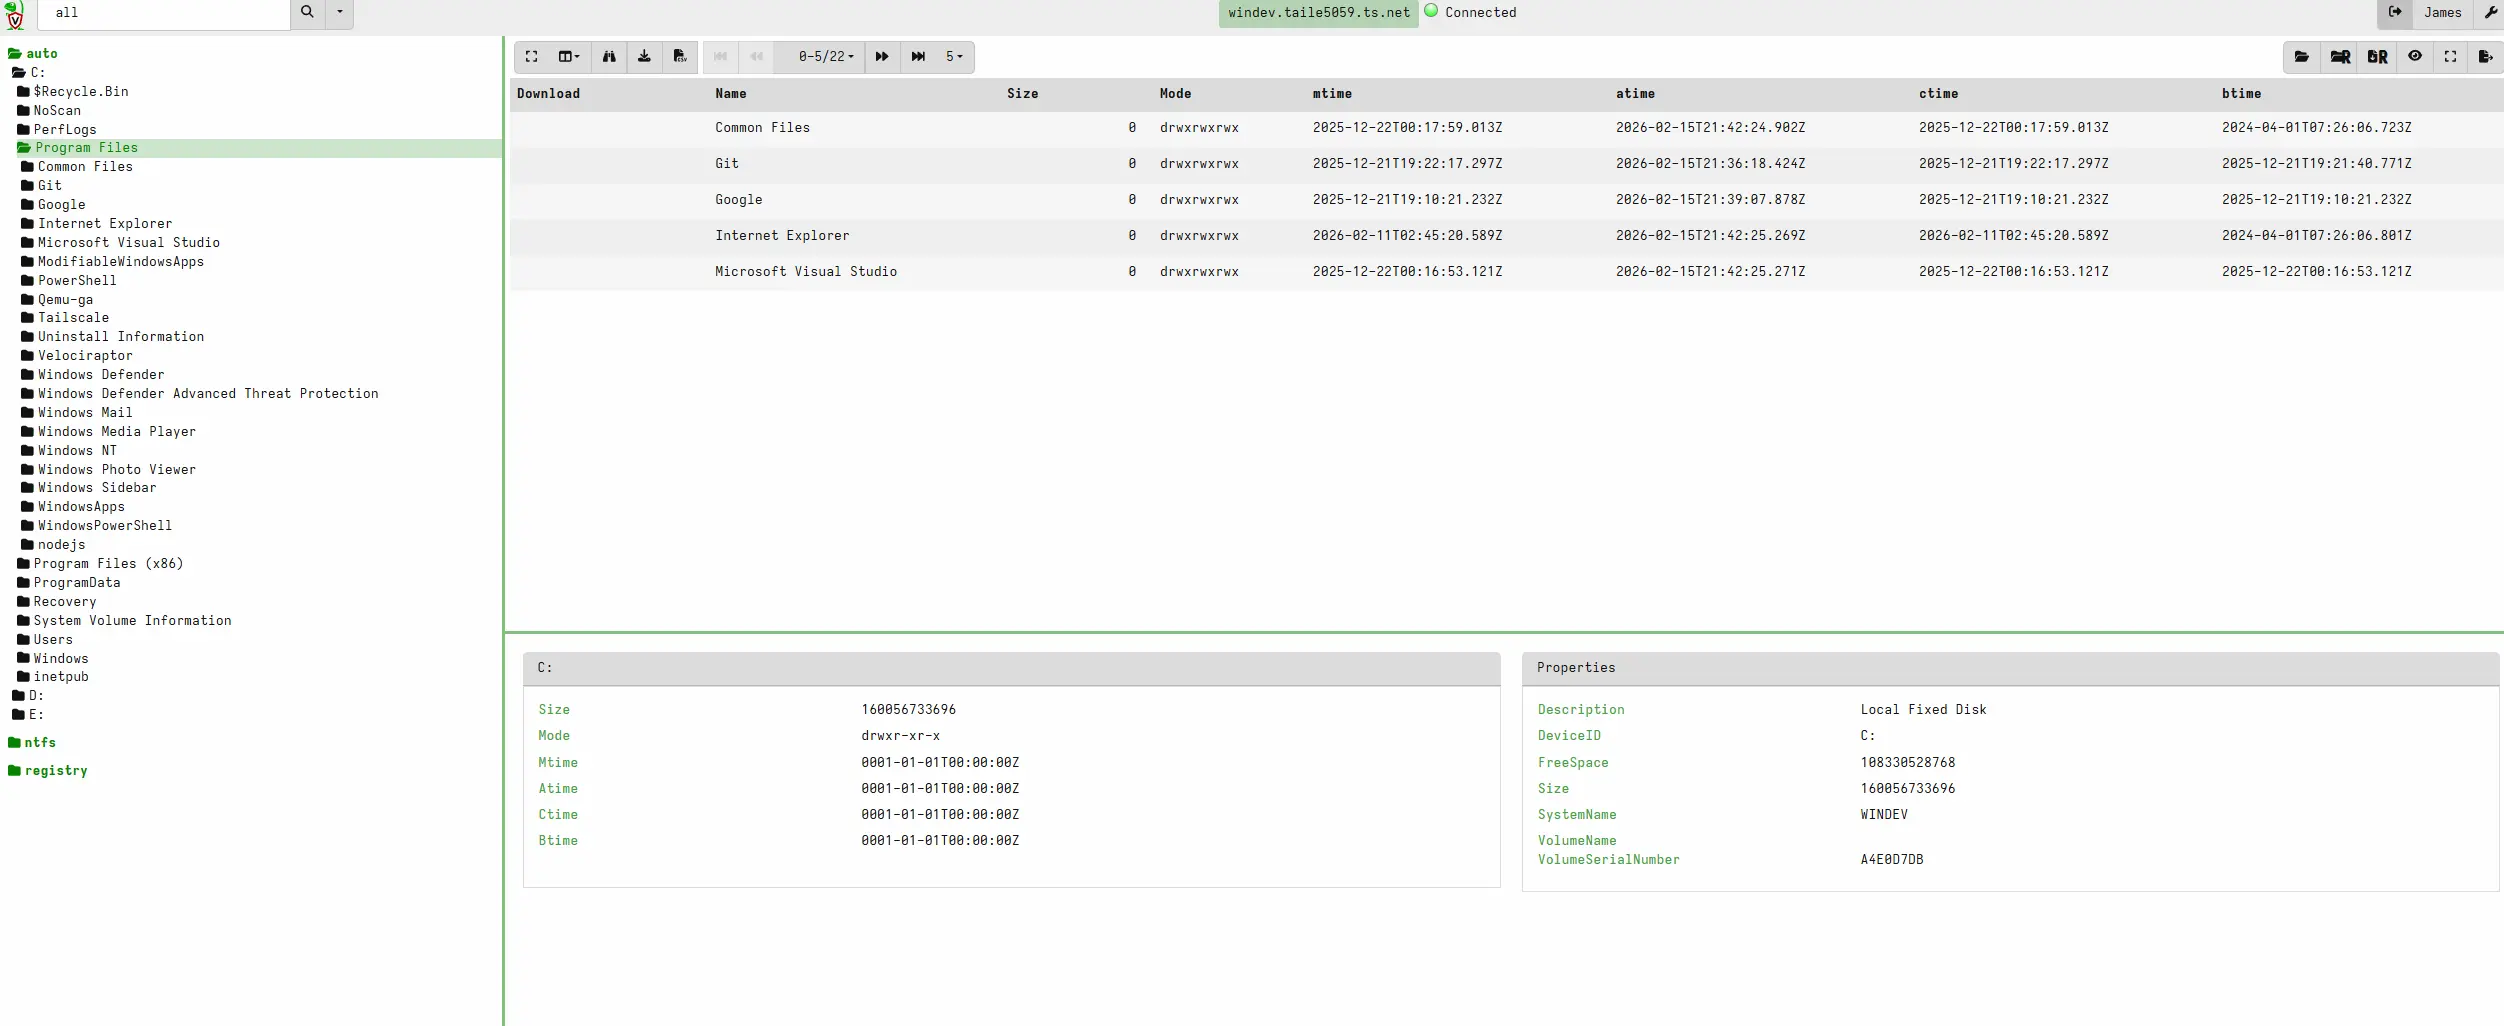
One of the first things you can do once connected to a host is browse its file system through the Virtual File System (VFS). This gives you a remote view of the endpoint’s files without needing to RDP or SSH into it.
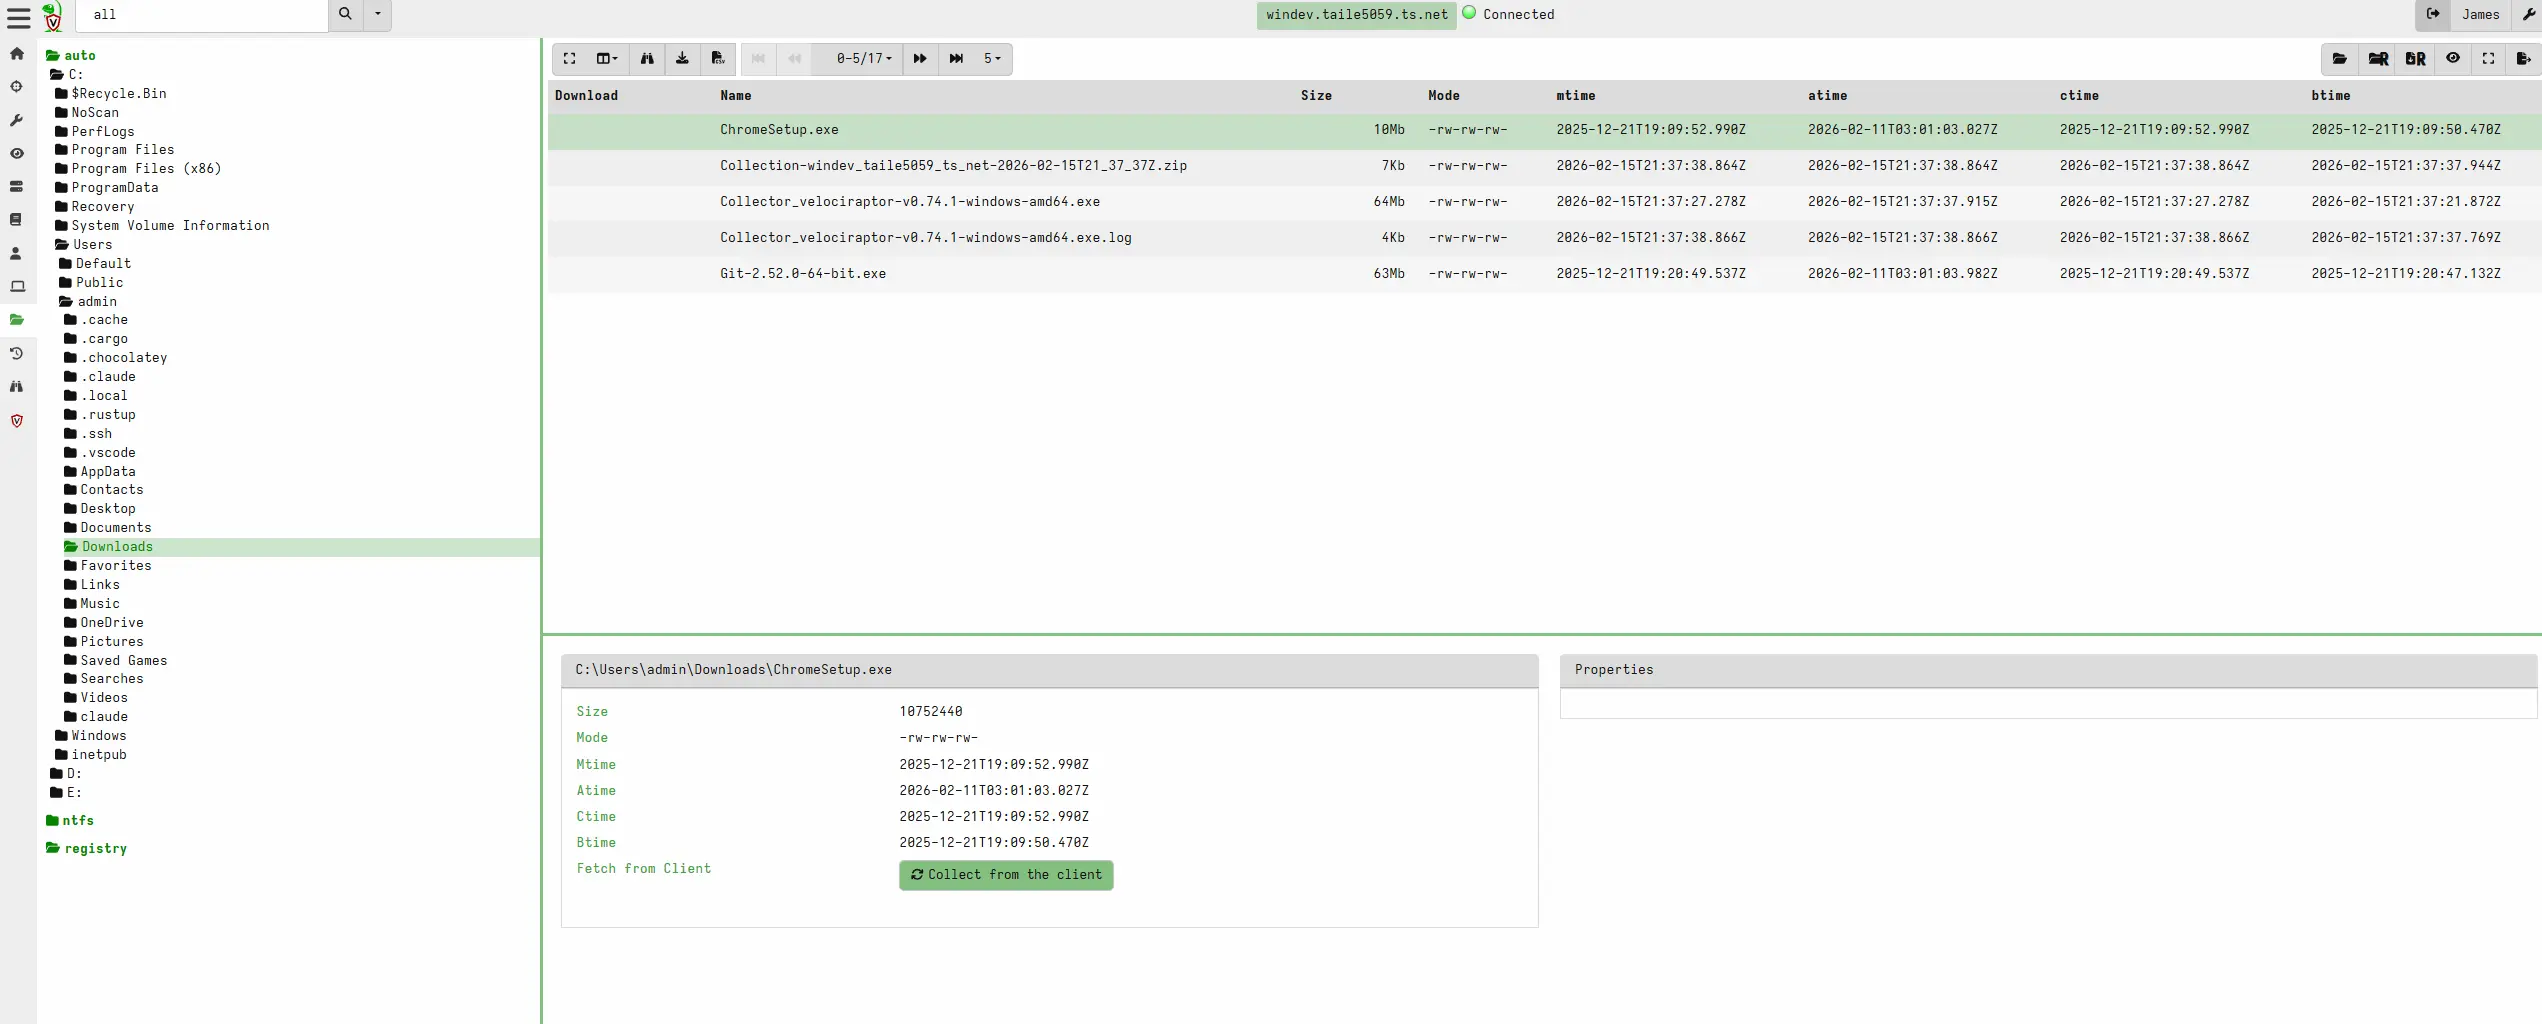
You can also collect files directly from the client through the VFS. This is useful when you need to pull a specific file off of a machine for analysis without alerting anyone on the endpoint.
Artifacts
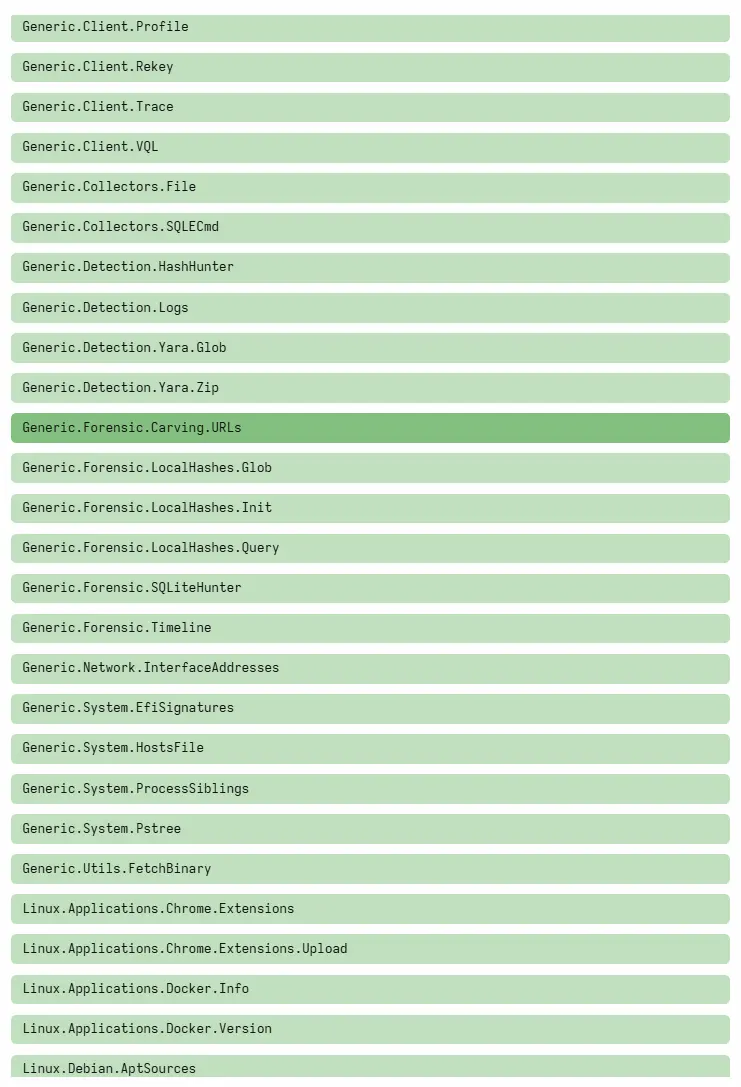
The real power of Velociraptor is in its artifact library. Artifacts are predefined VQL queries that collect specific types of forensic data from endpoints. The list is extensive and covers everything from system information to evidence of attacker activity.
Artifact Results
Generic Client Info
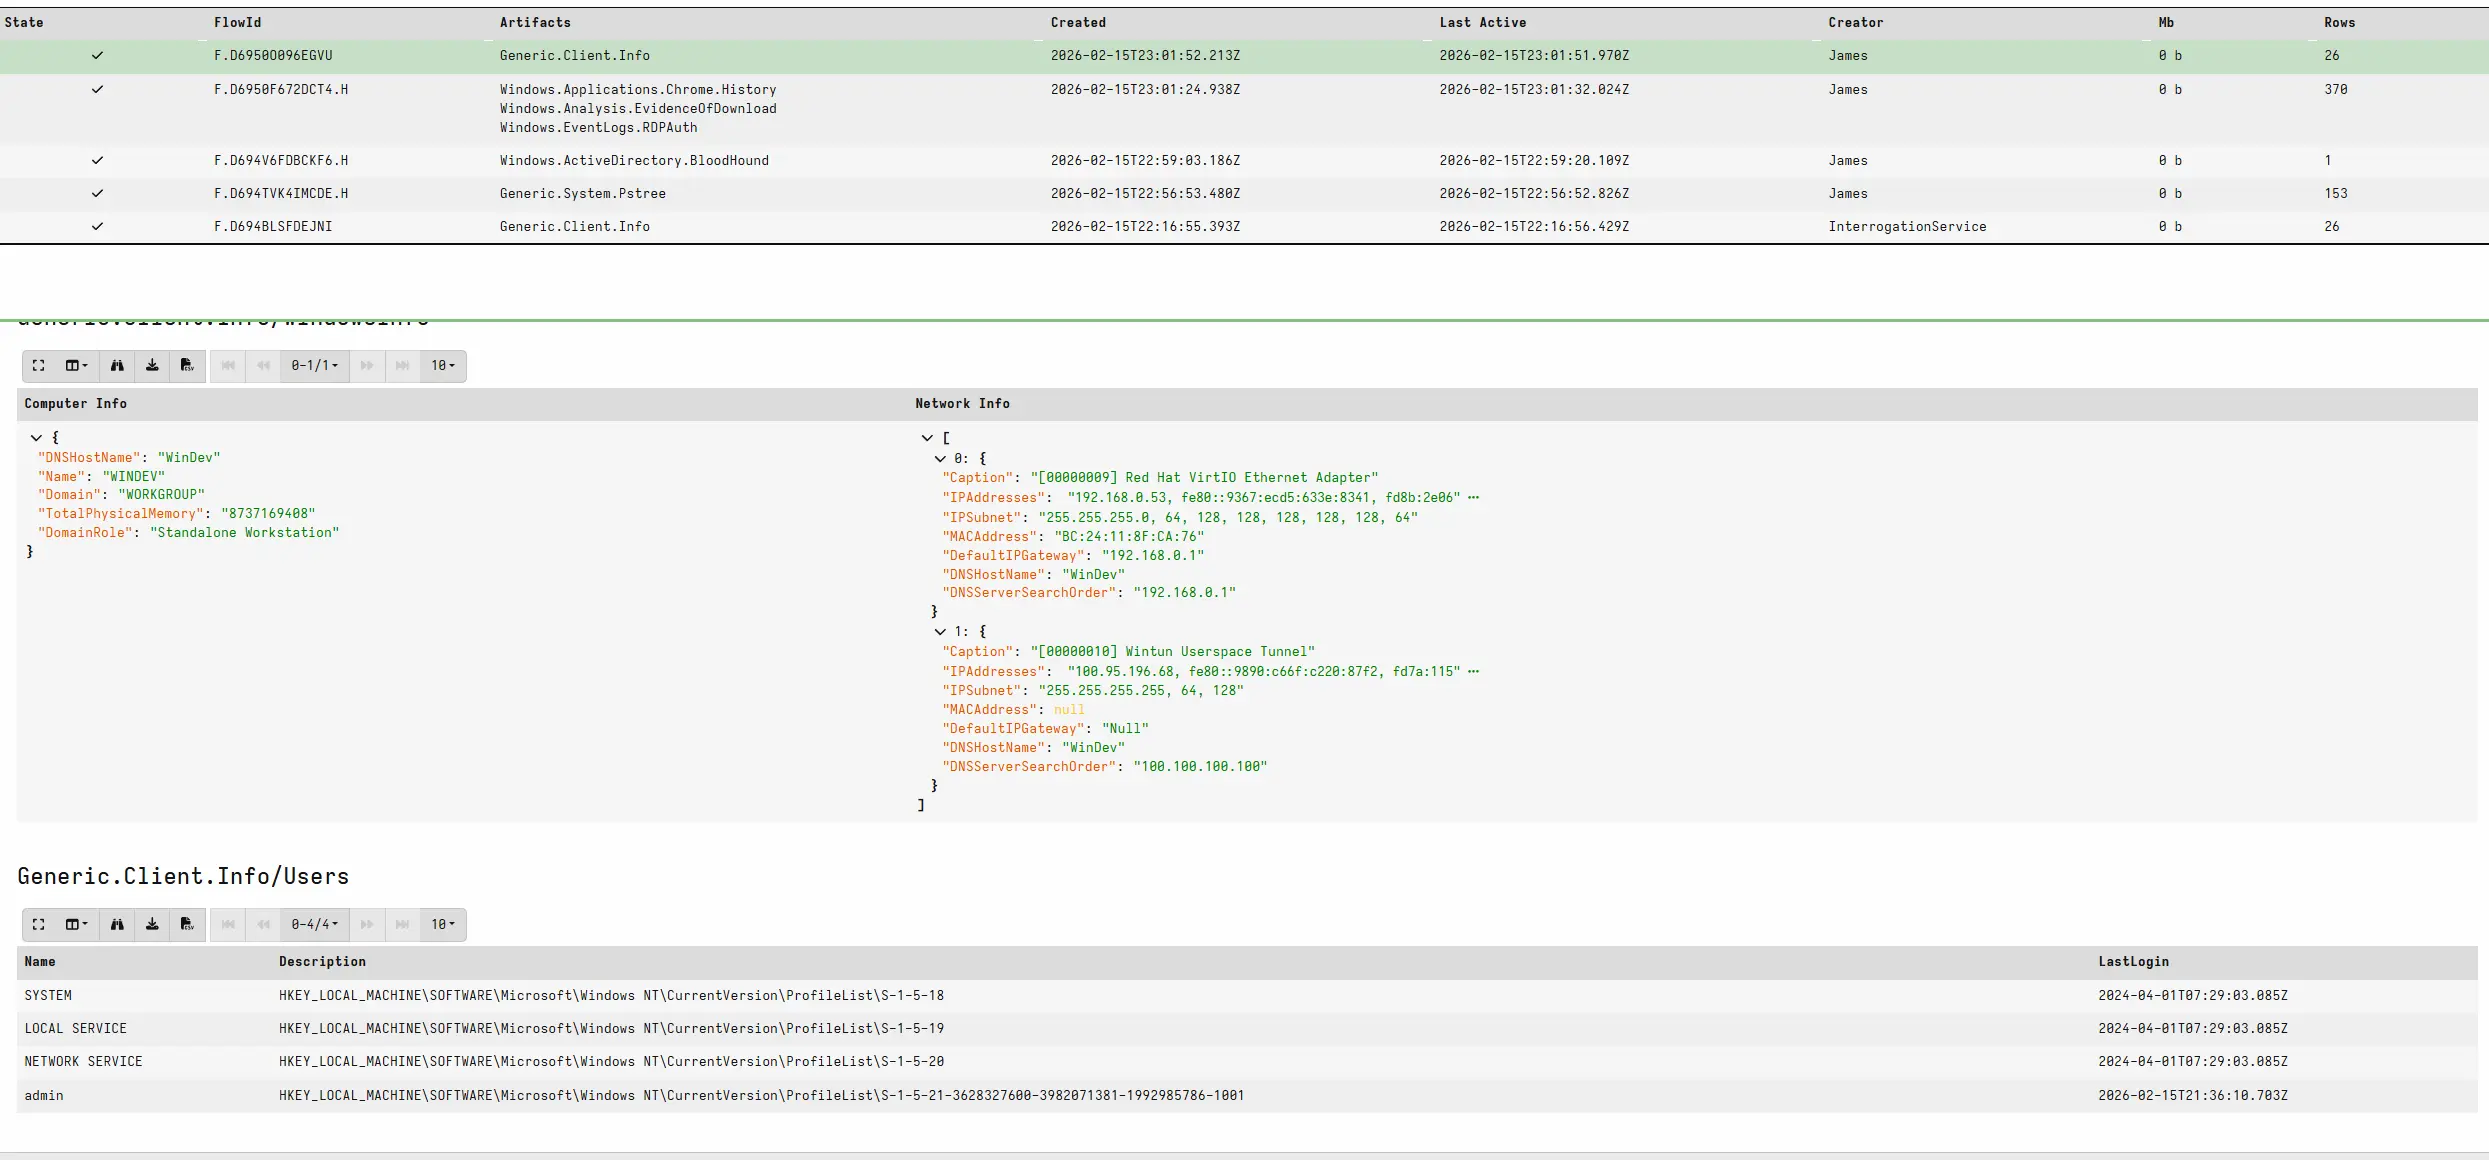
Starting with the basics, the Generic.Client.Info artifact pulls general system information about the host. This gives you the OS version, hostname, hardware details, and other baseline data that is useful for identifying the machine and understanding what you are working with.
Process Tree
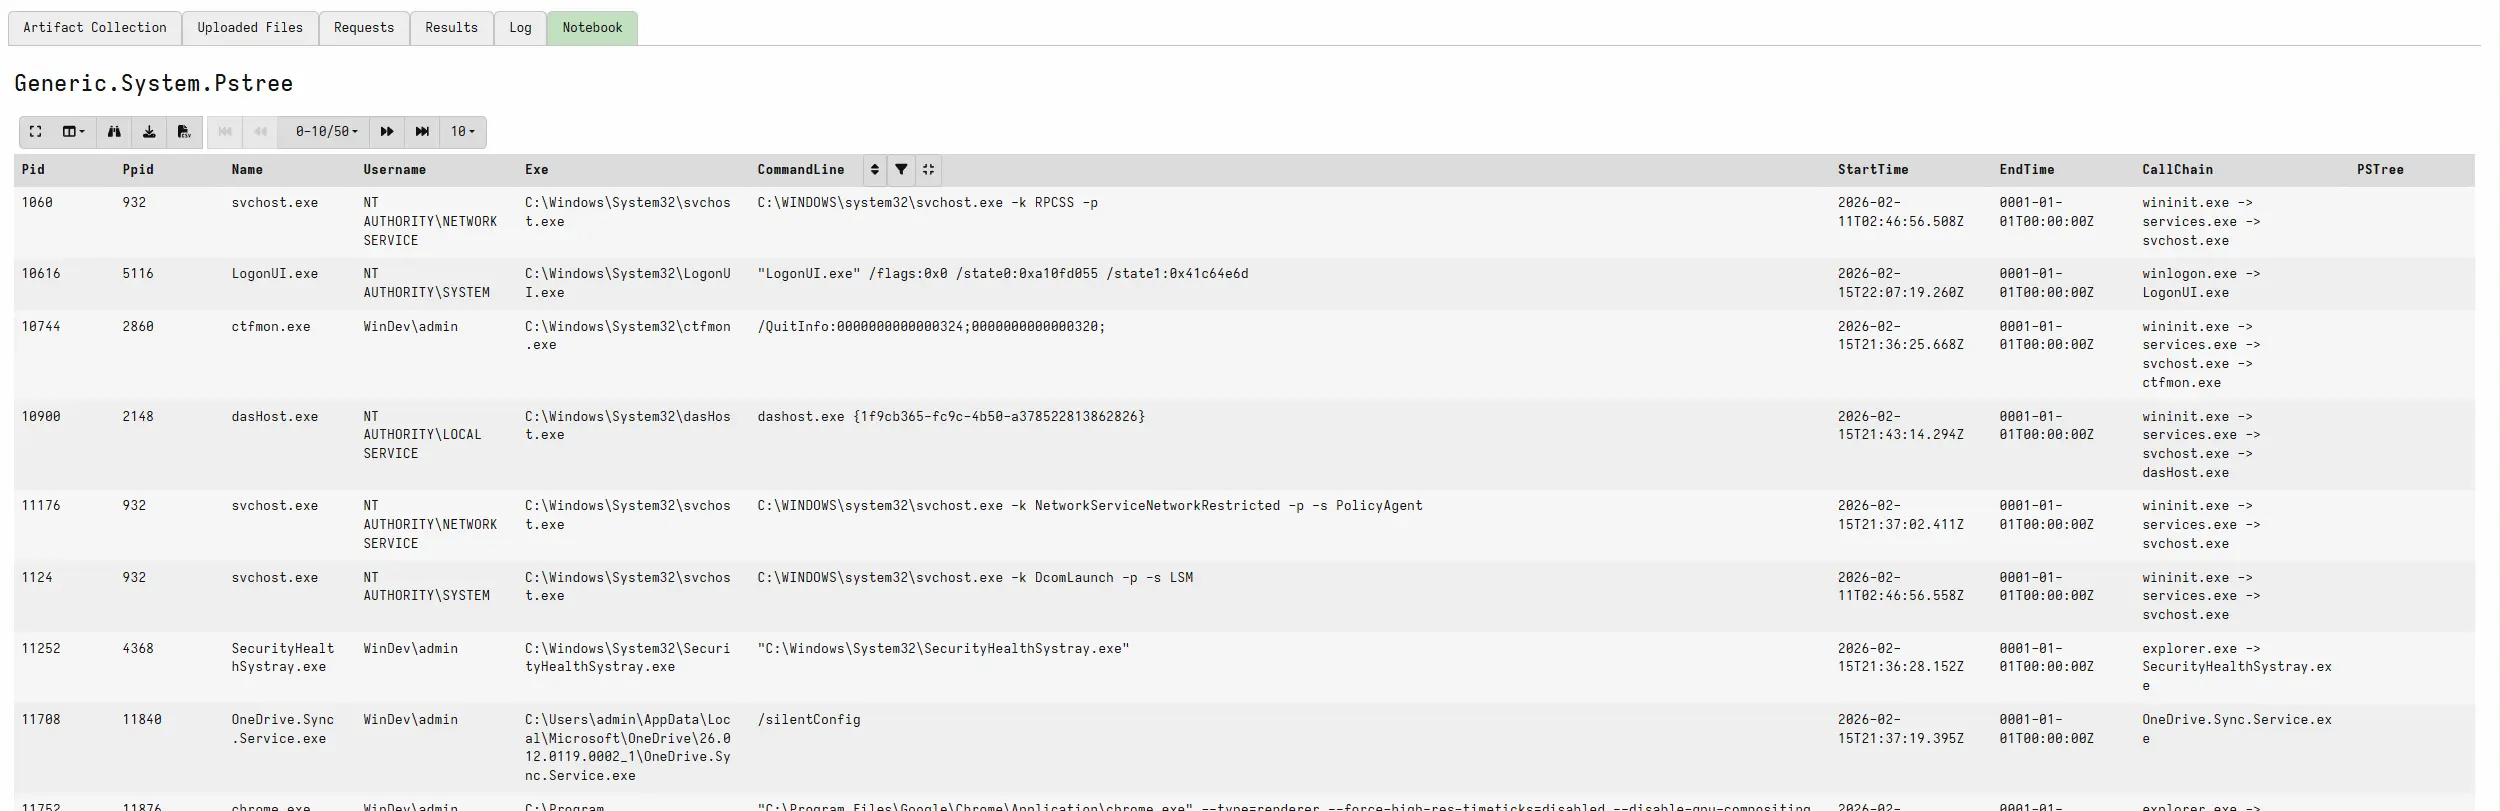
The process tree artifact shows parent-child relationships between running processes. This is critical for spotting suspicious process chains, like a Word document spawning PowerShell or cmd.exe launching from an unusual parent. The tree view makes these relationships immediately visible.
Process List
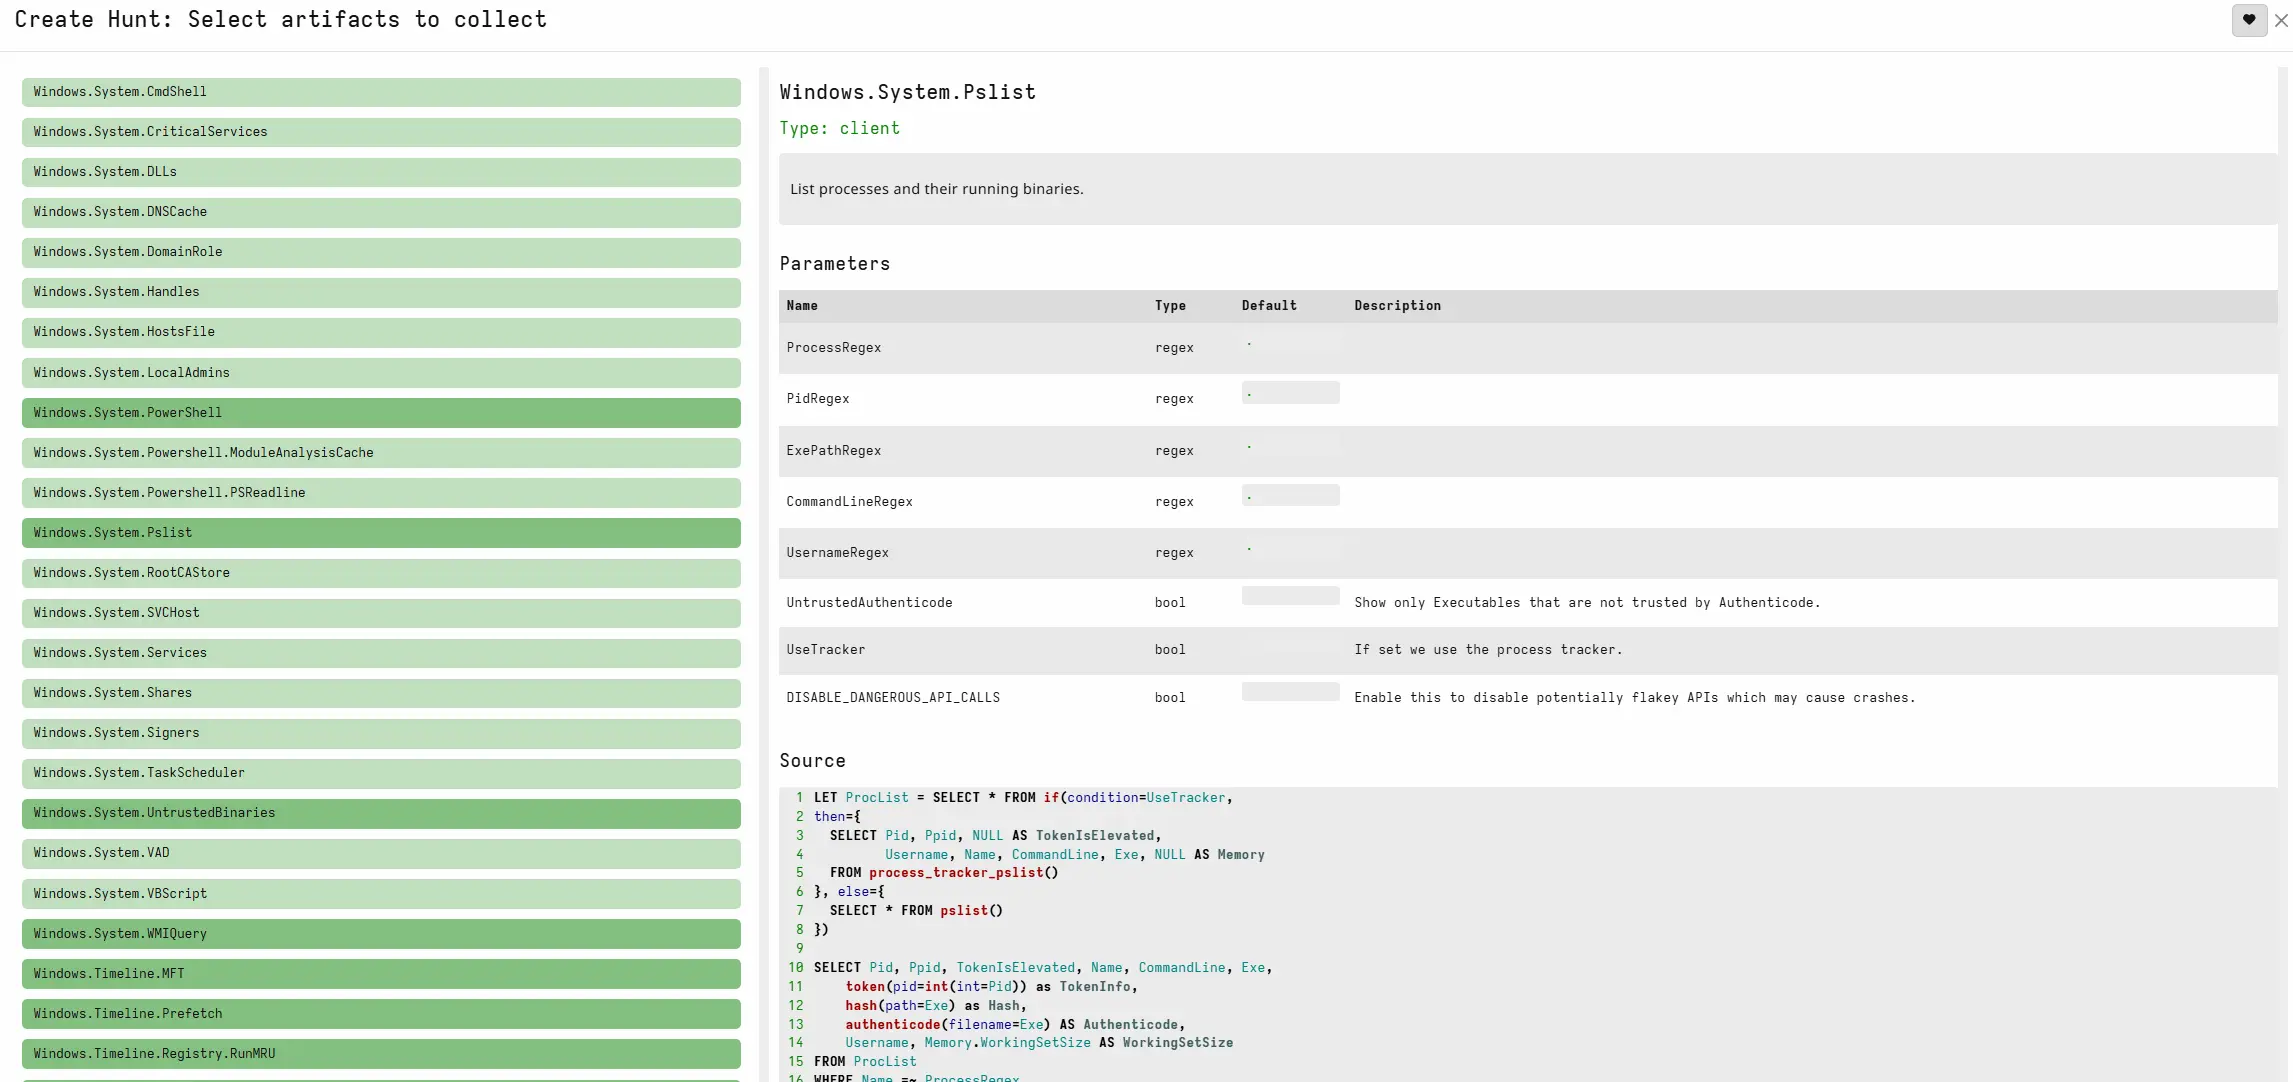
The process list gives you a flat view of all running processes with details like PID, name, command line arguments, and user context. This is where you look for processes that should not be there or legitimate processes running with suspicious arguments.
Netstat Enriched
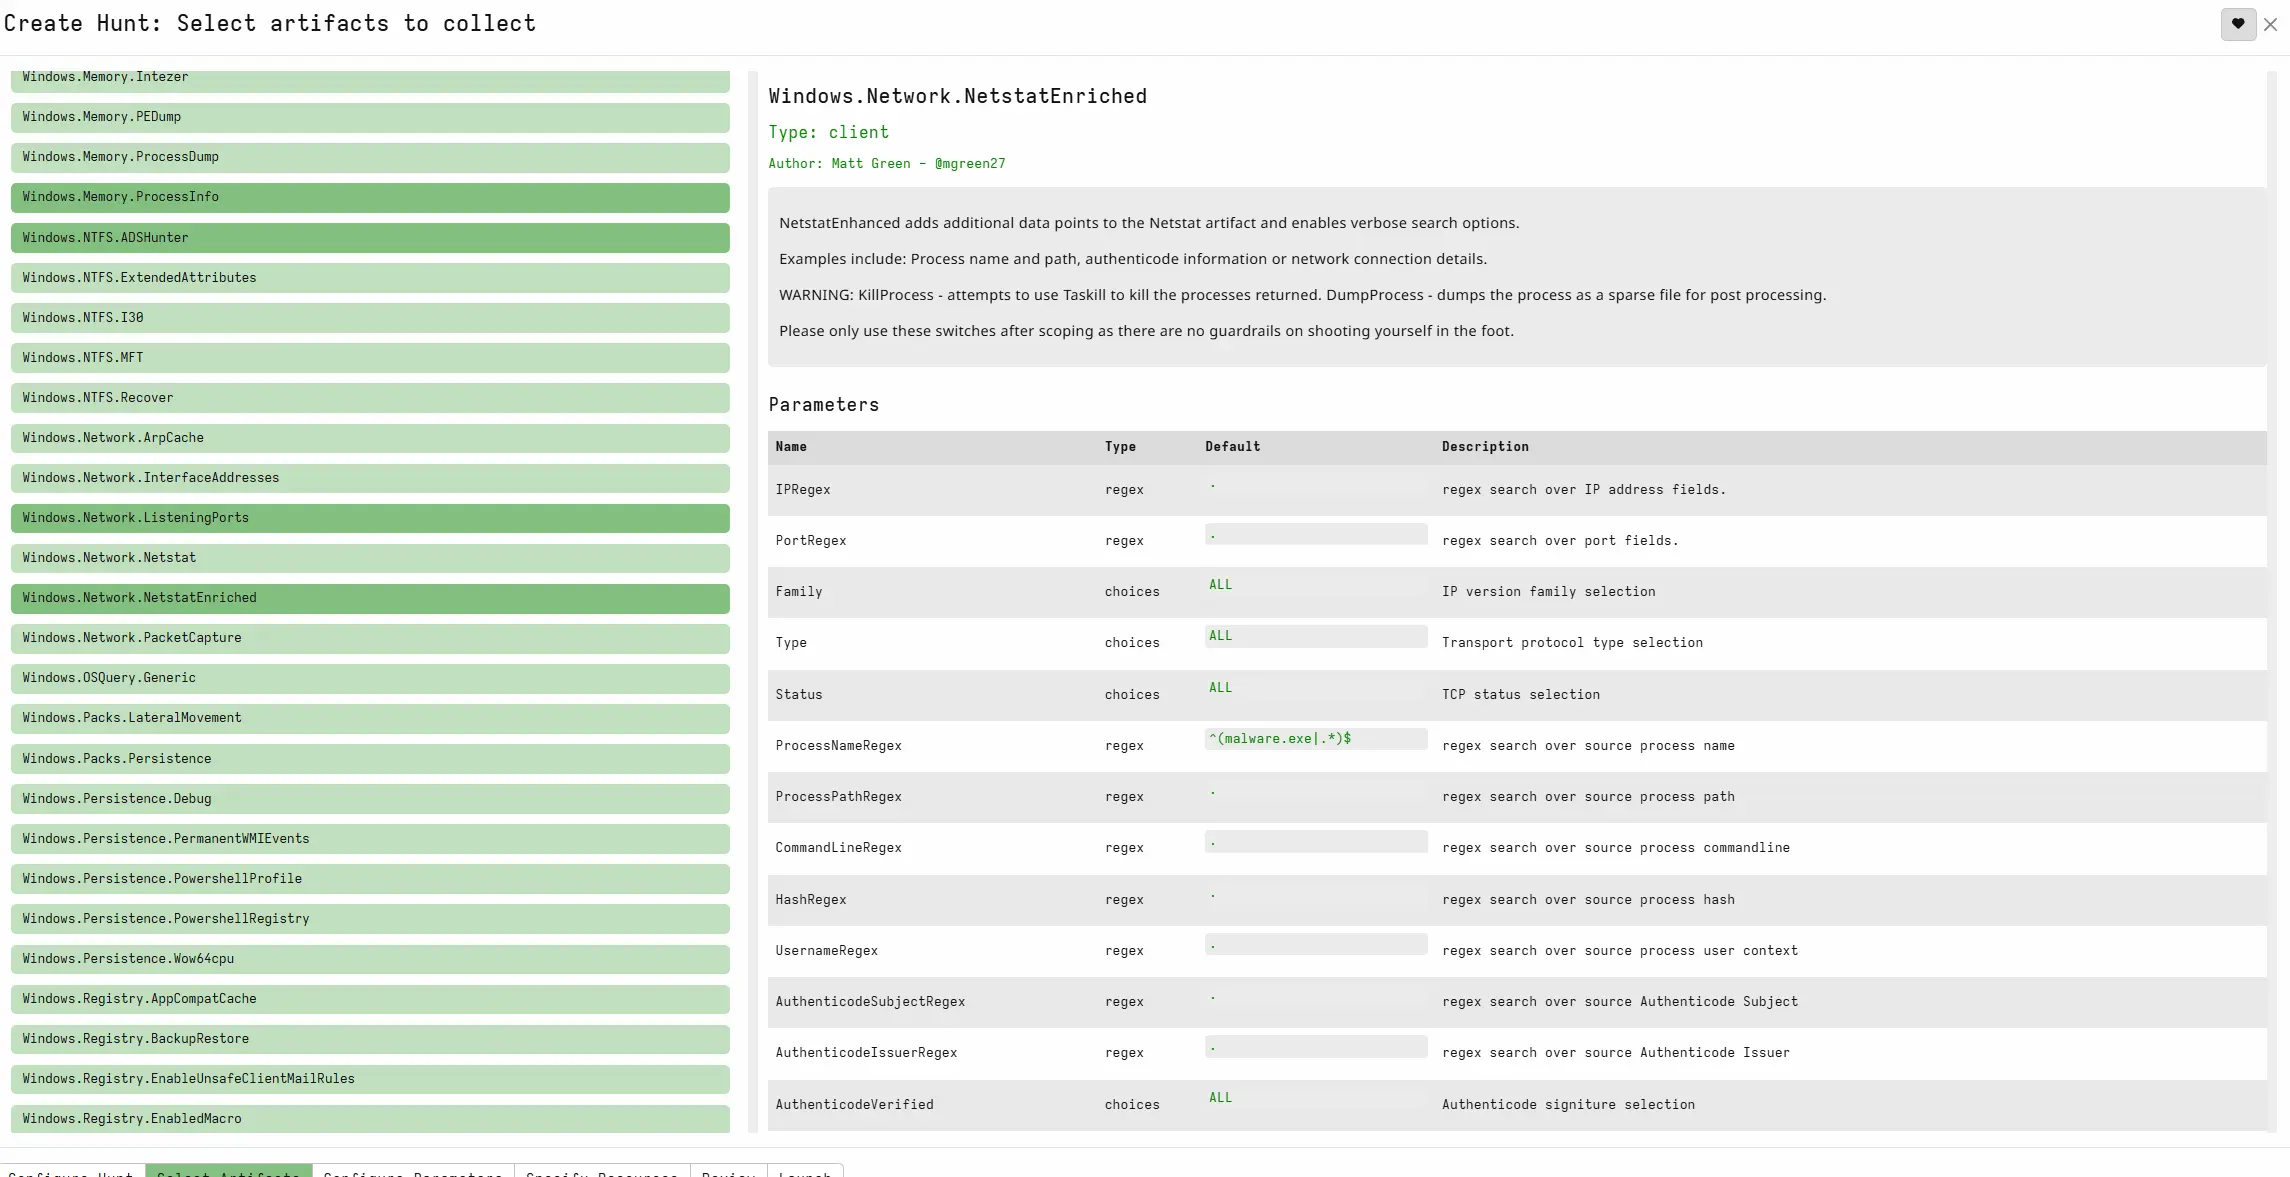
The enriched netstat artifact goes beyond a standard netstat by correlating network connections with the processes that own them. You can see exactly which process is talking to which remote IP and port. This makes it easy to spot beaconing, data exfiltration, or unauthorized connections.
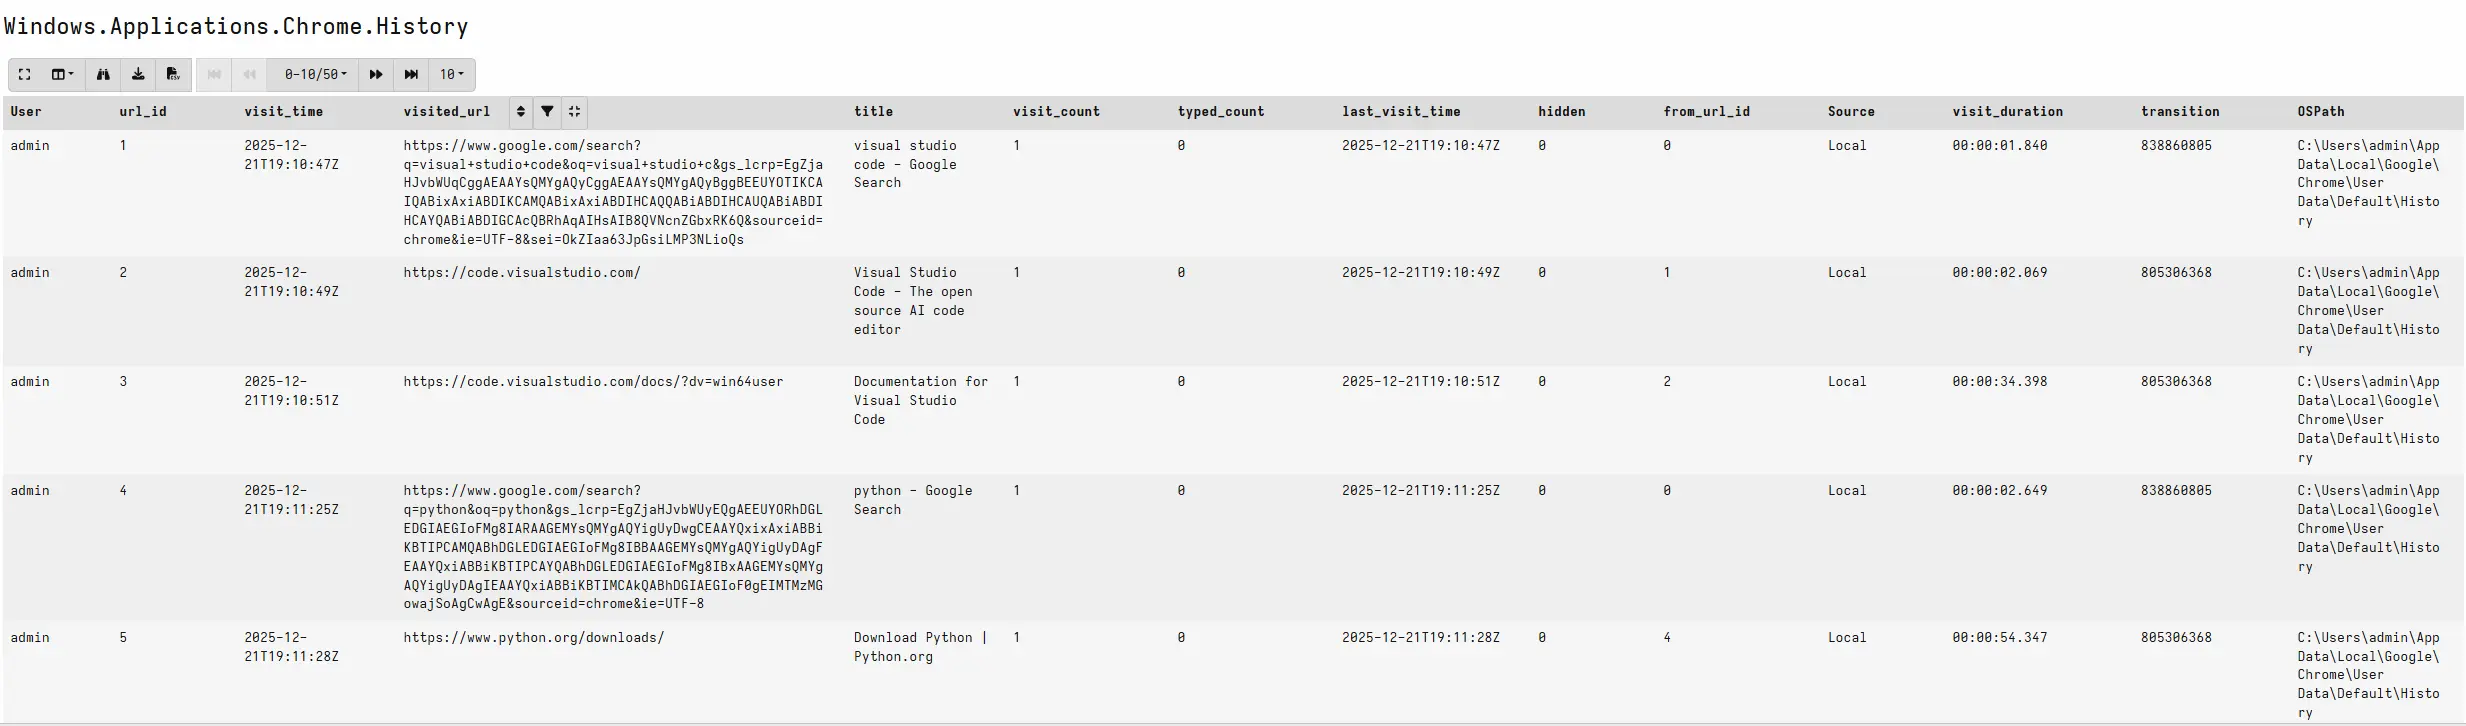
Chrome History
Browser history is a goldmine during investigations. The Chrome History artifact pulls the browsing history from the endpoint, showing URLs visited, timestamps, and visit counts. If an attacker used the browser to download tools or access phishing pages, it shows up here.
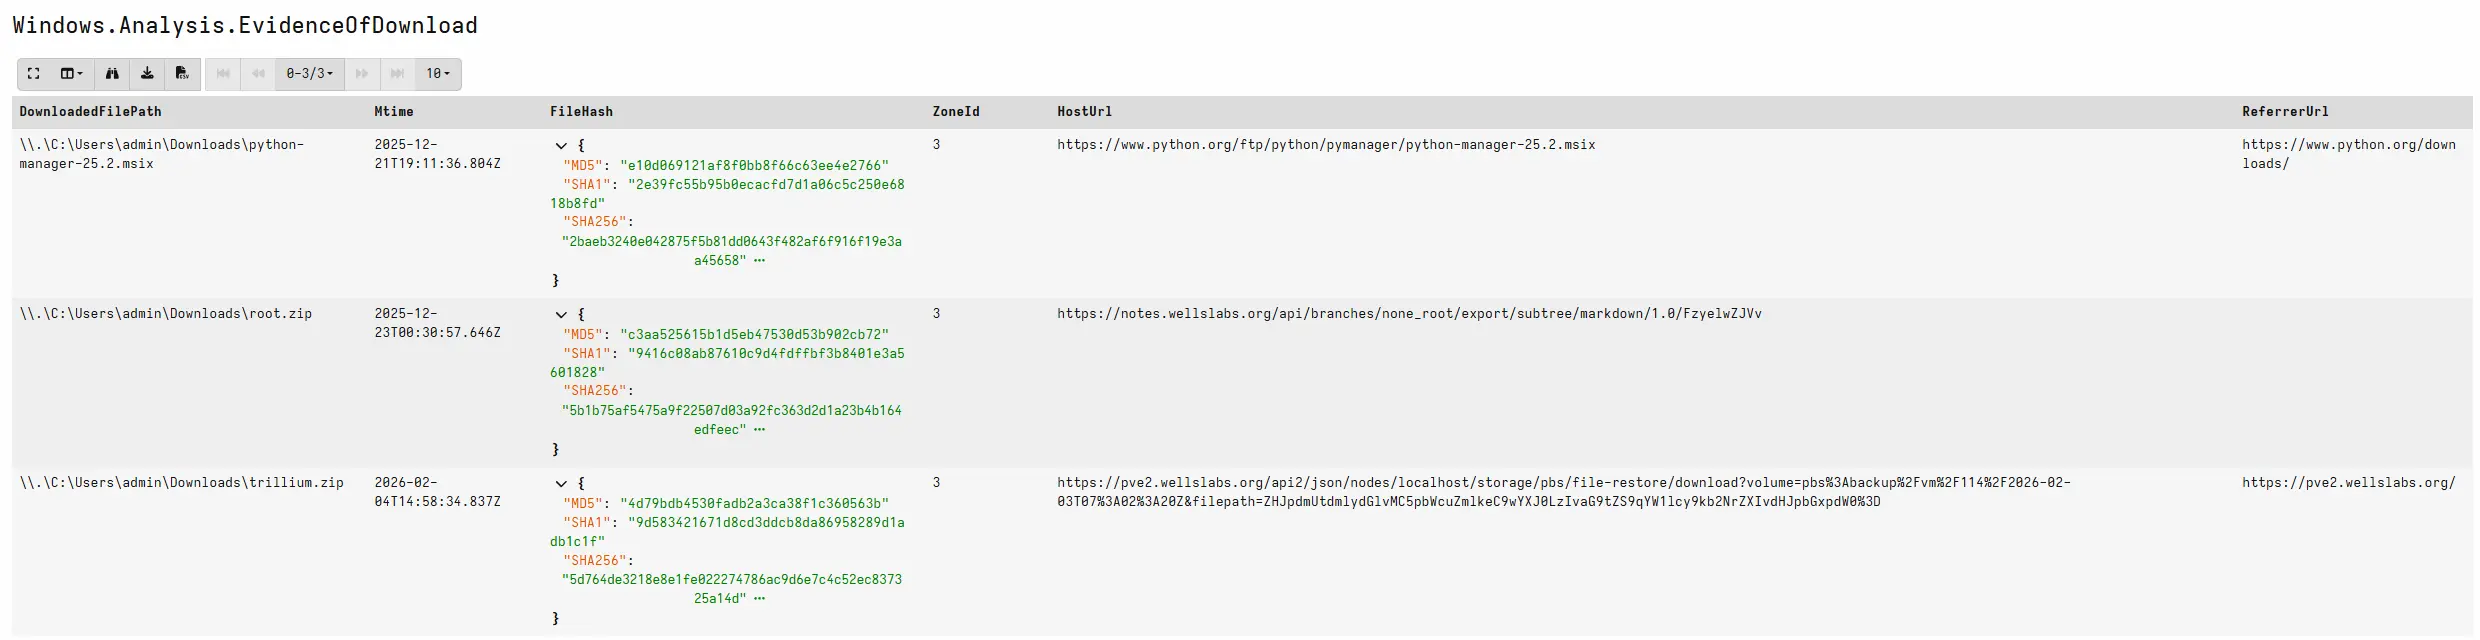
Evidence of Download
This artifact looks for evidence of files being downloaded to the system. It checks multiple sources to identify what was downloaded, when, and where it was saved. This is especially useful for tracking how malware or attacker tools arrived on the endpoint.
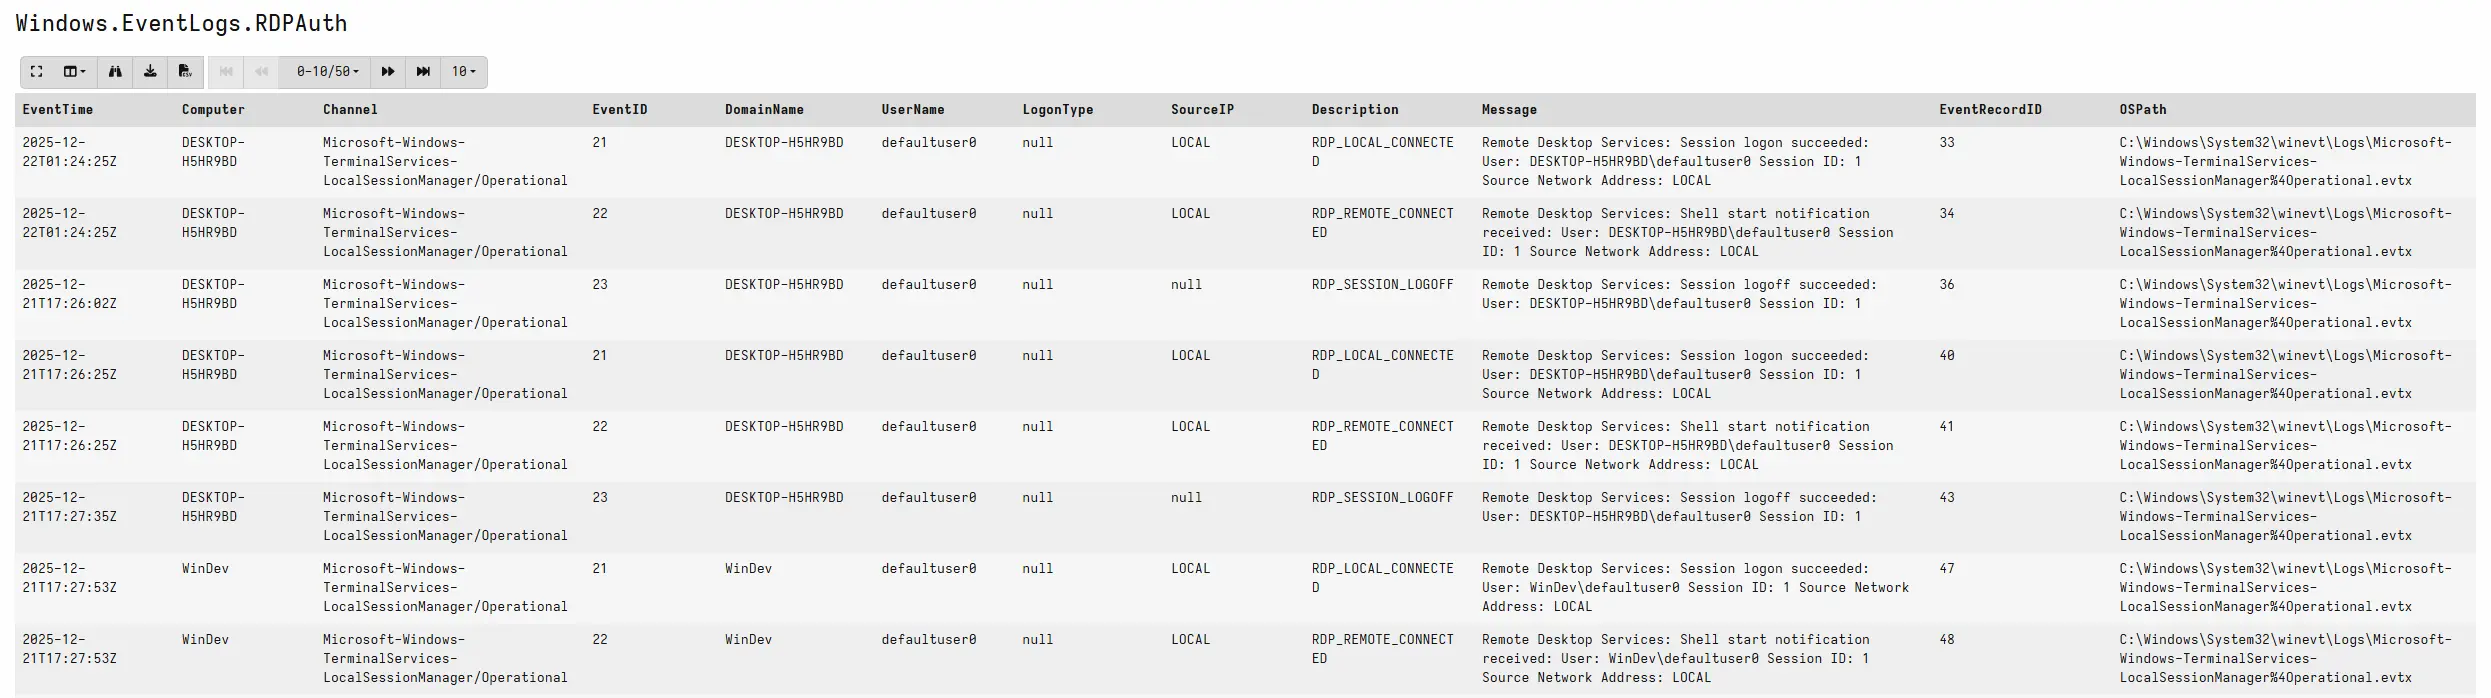
RDP Authentication
The RDP authentication artifact pulls Remote Desktop login events from the Windows event logs. This shows who has been connecting to the machine via RDP, when they connected, and from where. Lateral movement through RDP is one of the most common techniques attackers use, so this is always worth checking.
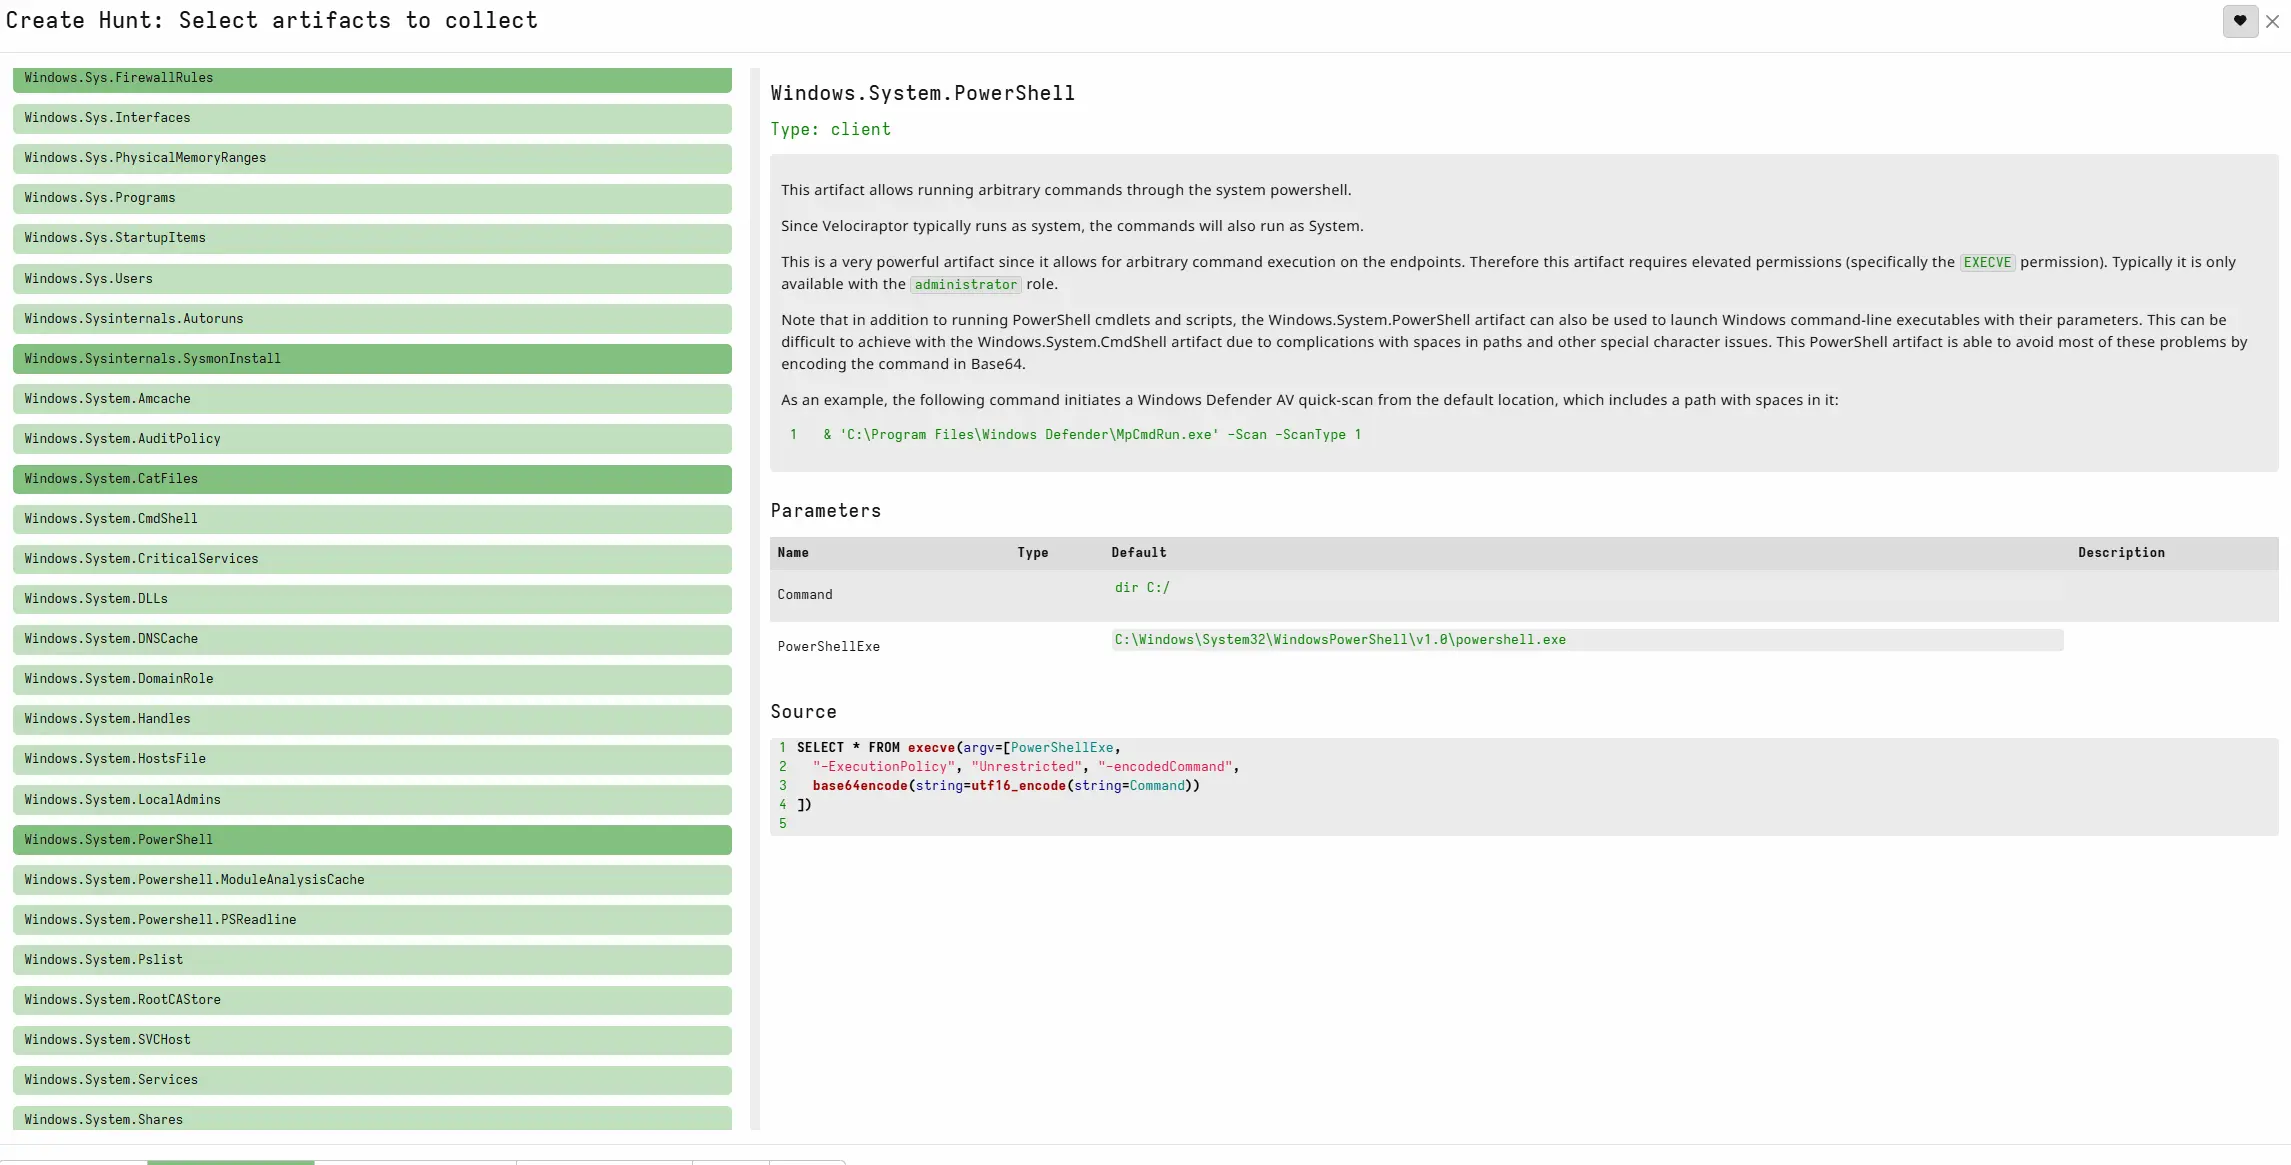
PowerShell Activity
PowerShell is one of the most abused tools in an attacker’s arsenal because it is built into every Windows machine. This artifact collects PowerShell execution history and script block logging, revealing what commands and scripts have been run. Encoded commands and downloads from remote URLs stand out immediately.
Certutil Usage
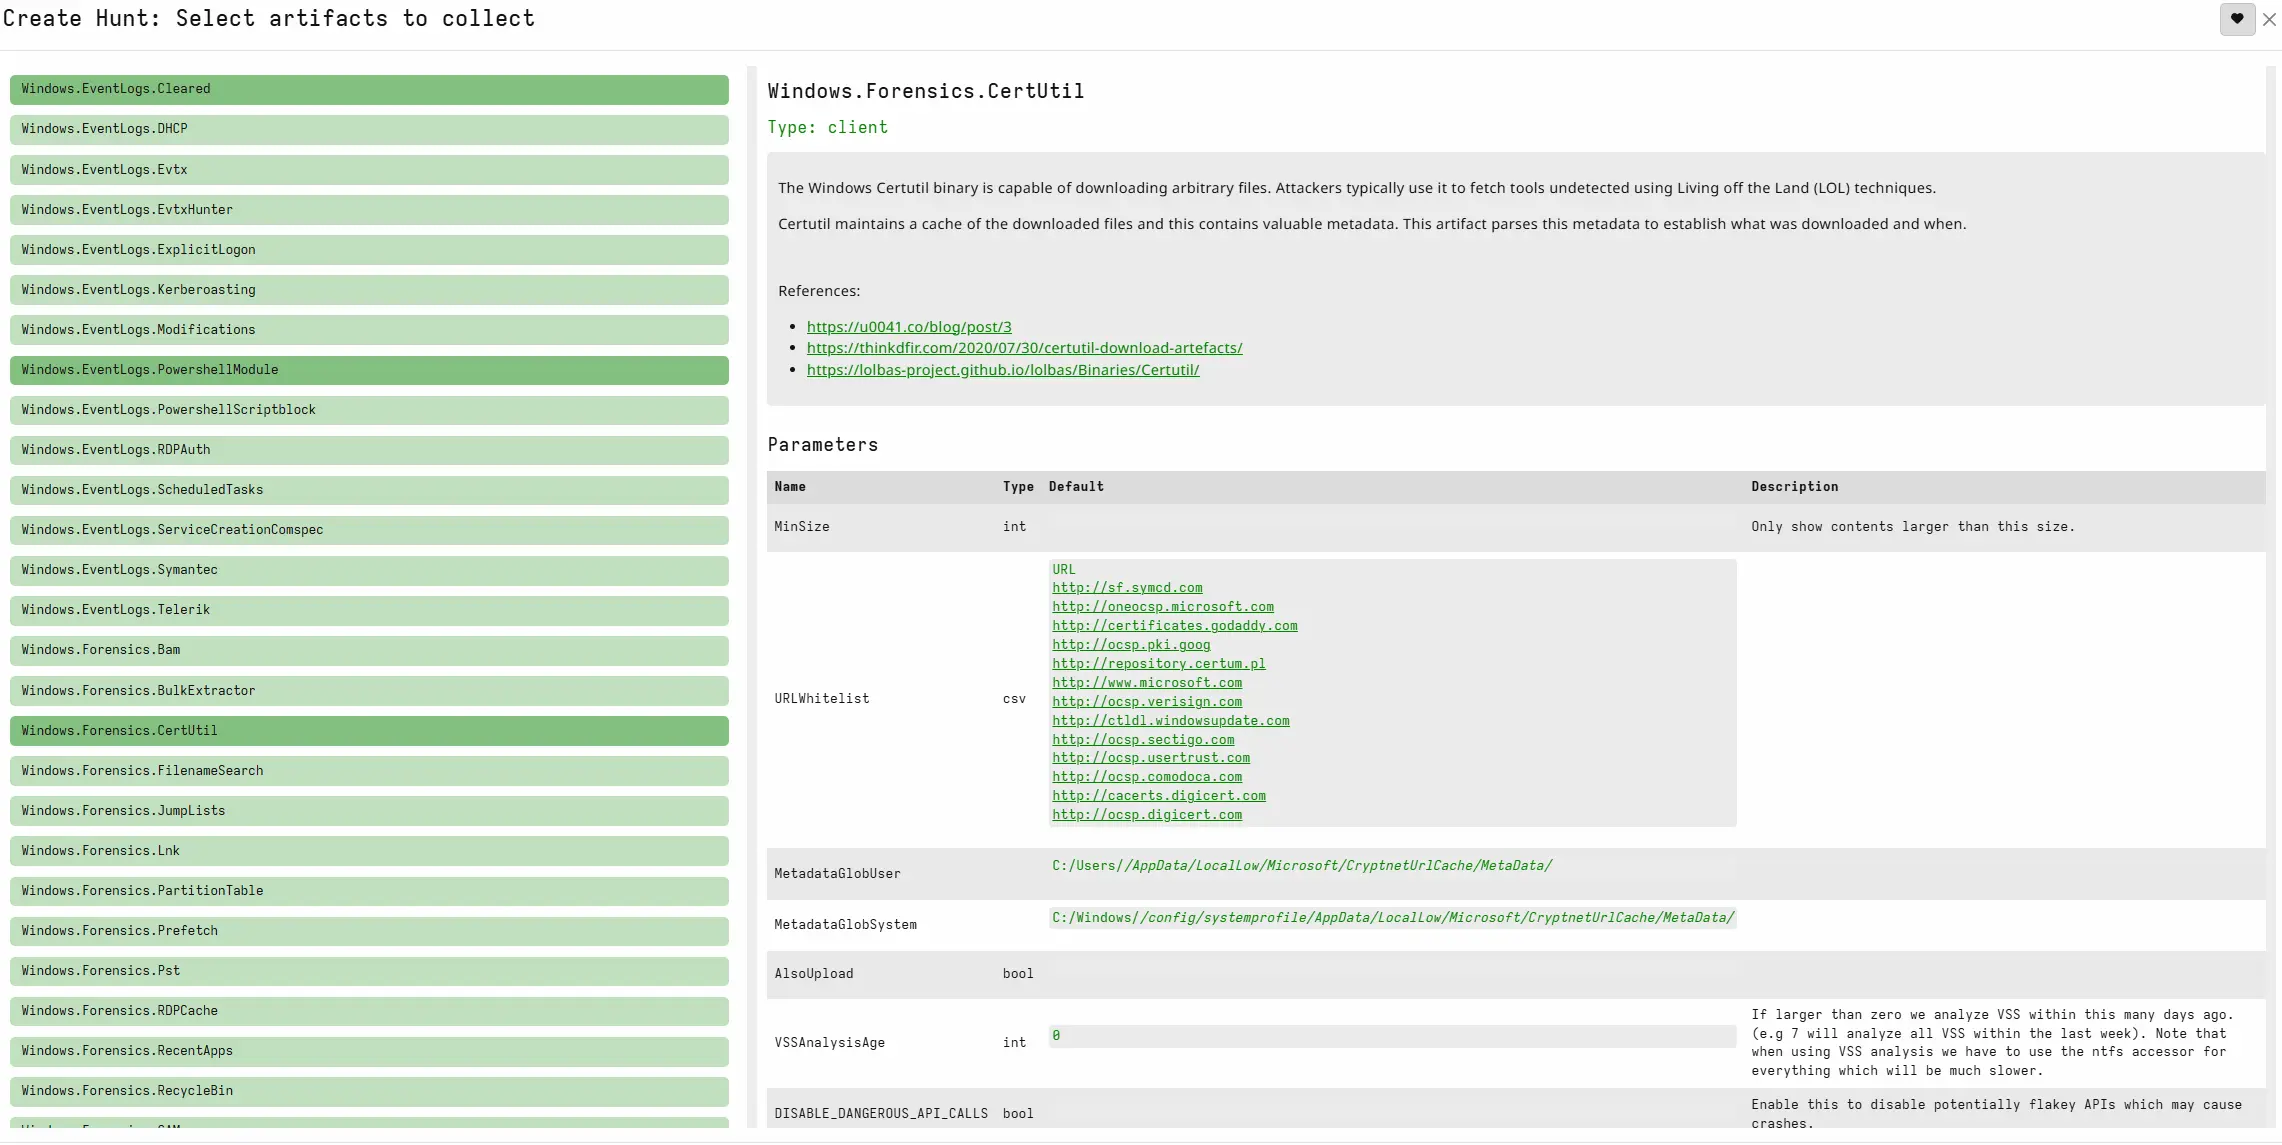
Certutil is a legitimate Windows utility that attackers frequently abuse to download files, decode payloads, and bypass security controls. This artifact looks for evidence of certutil being used in suspicious ways. If someone used certutil to pull down a payload, it will show up here.
Cleared Event Logs
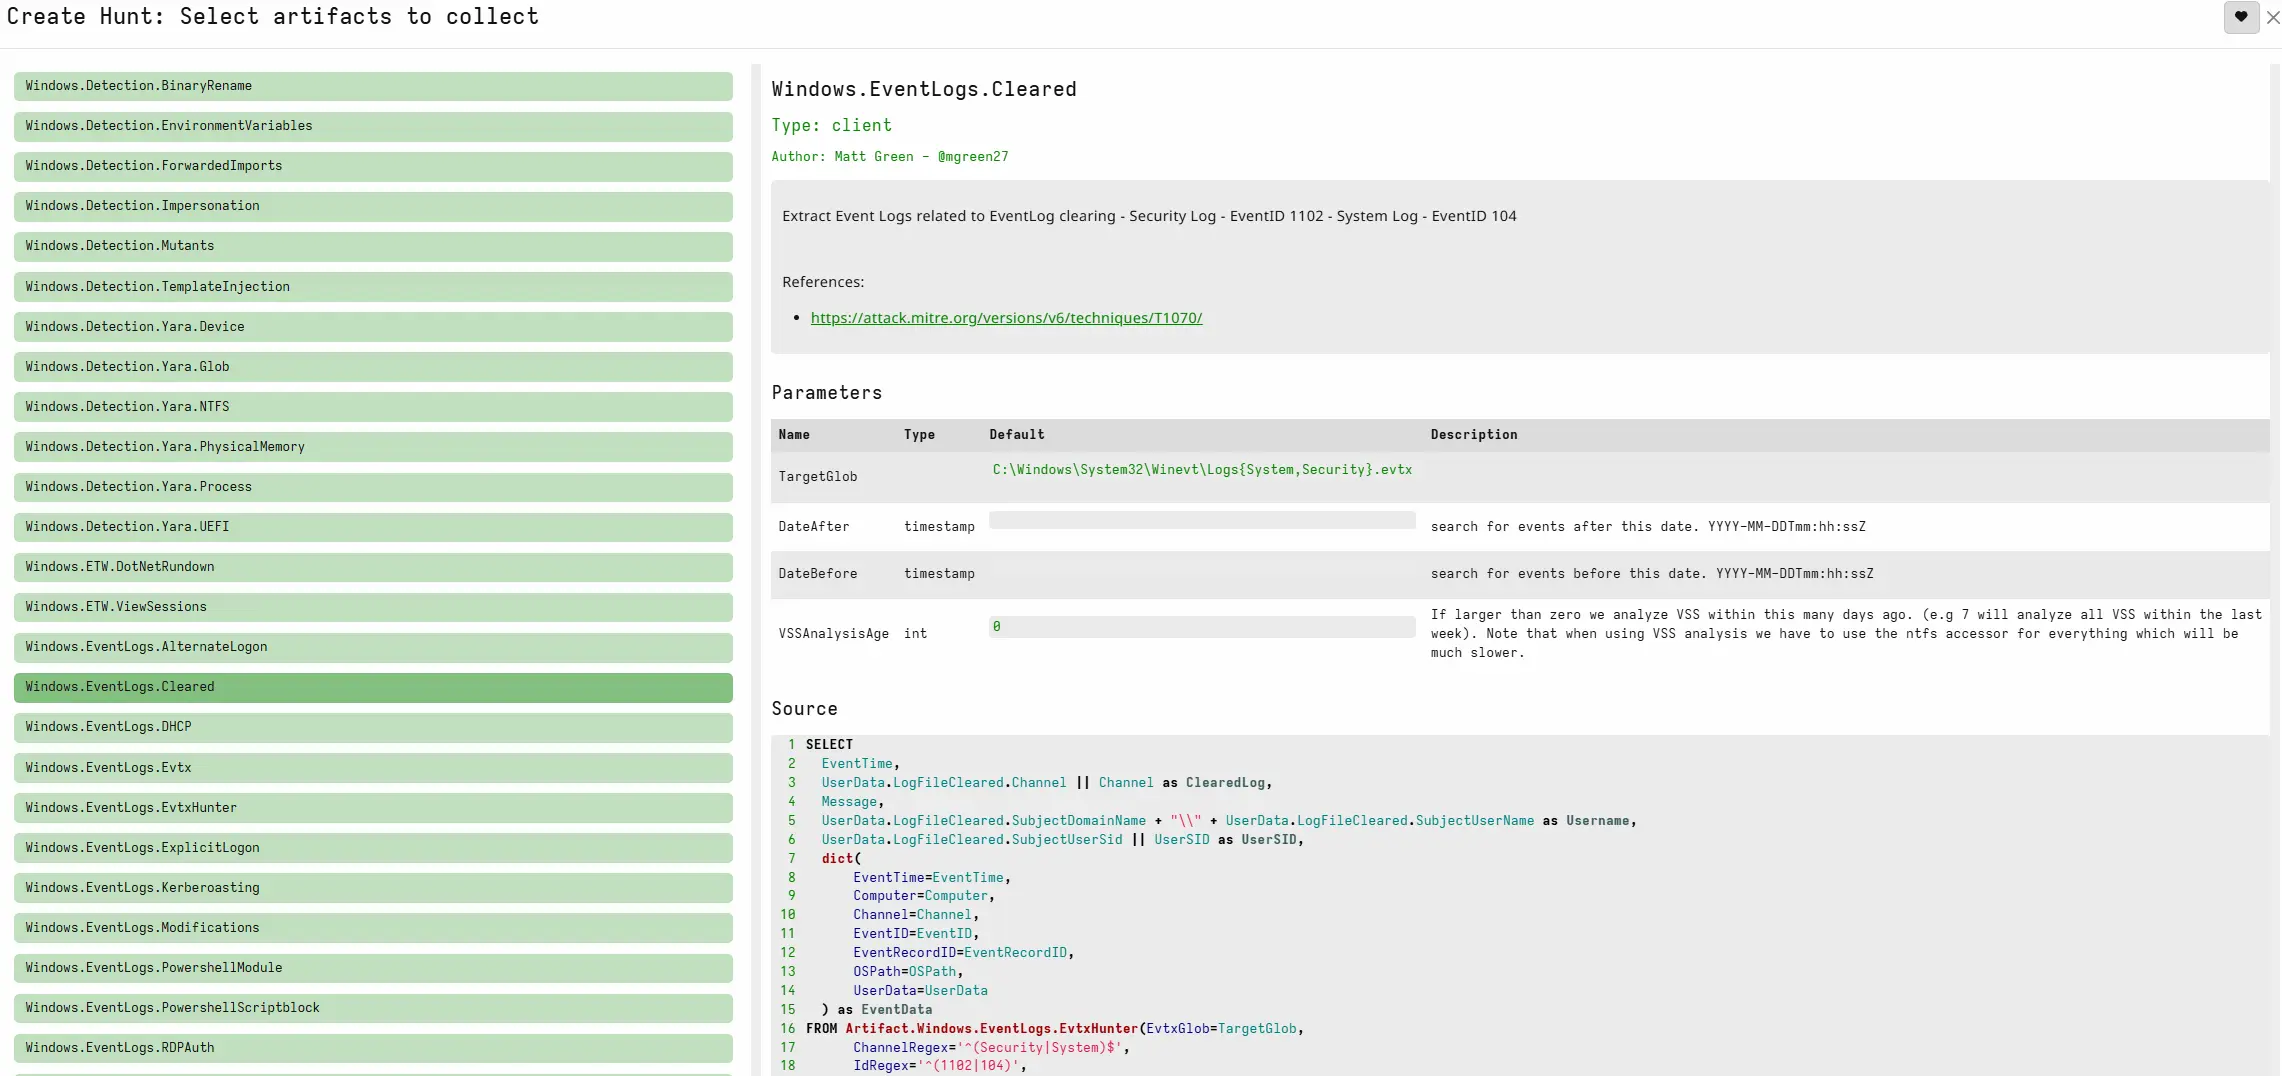
One of the first things an attacker might do after gaining access is clear the event logs to cover their tracks. This artifact detects when event logs have been cleared, which is itself a strong indicator of compromise. Legitimate administrators rarely clear event logs, so any hits here warrant investigation.
ADS Hunter
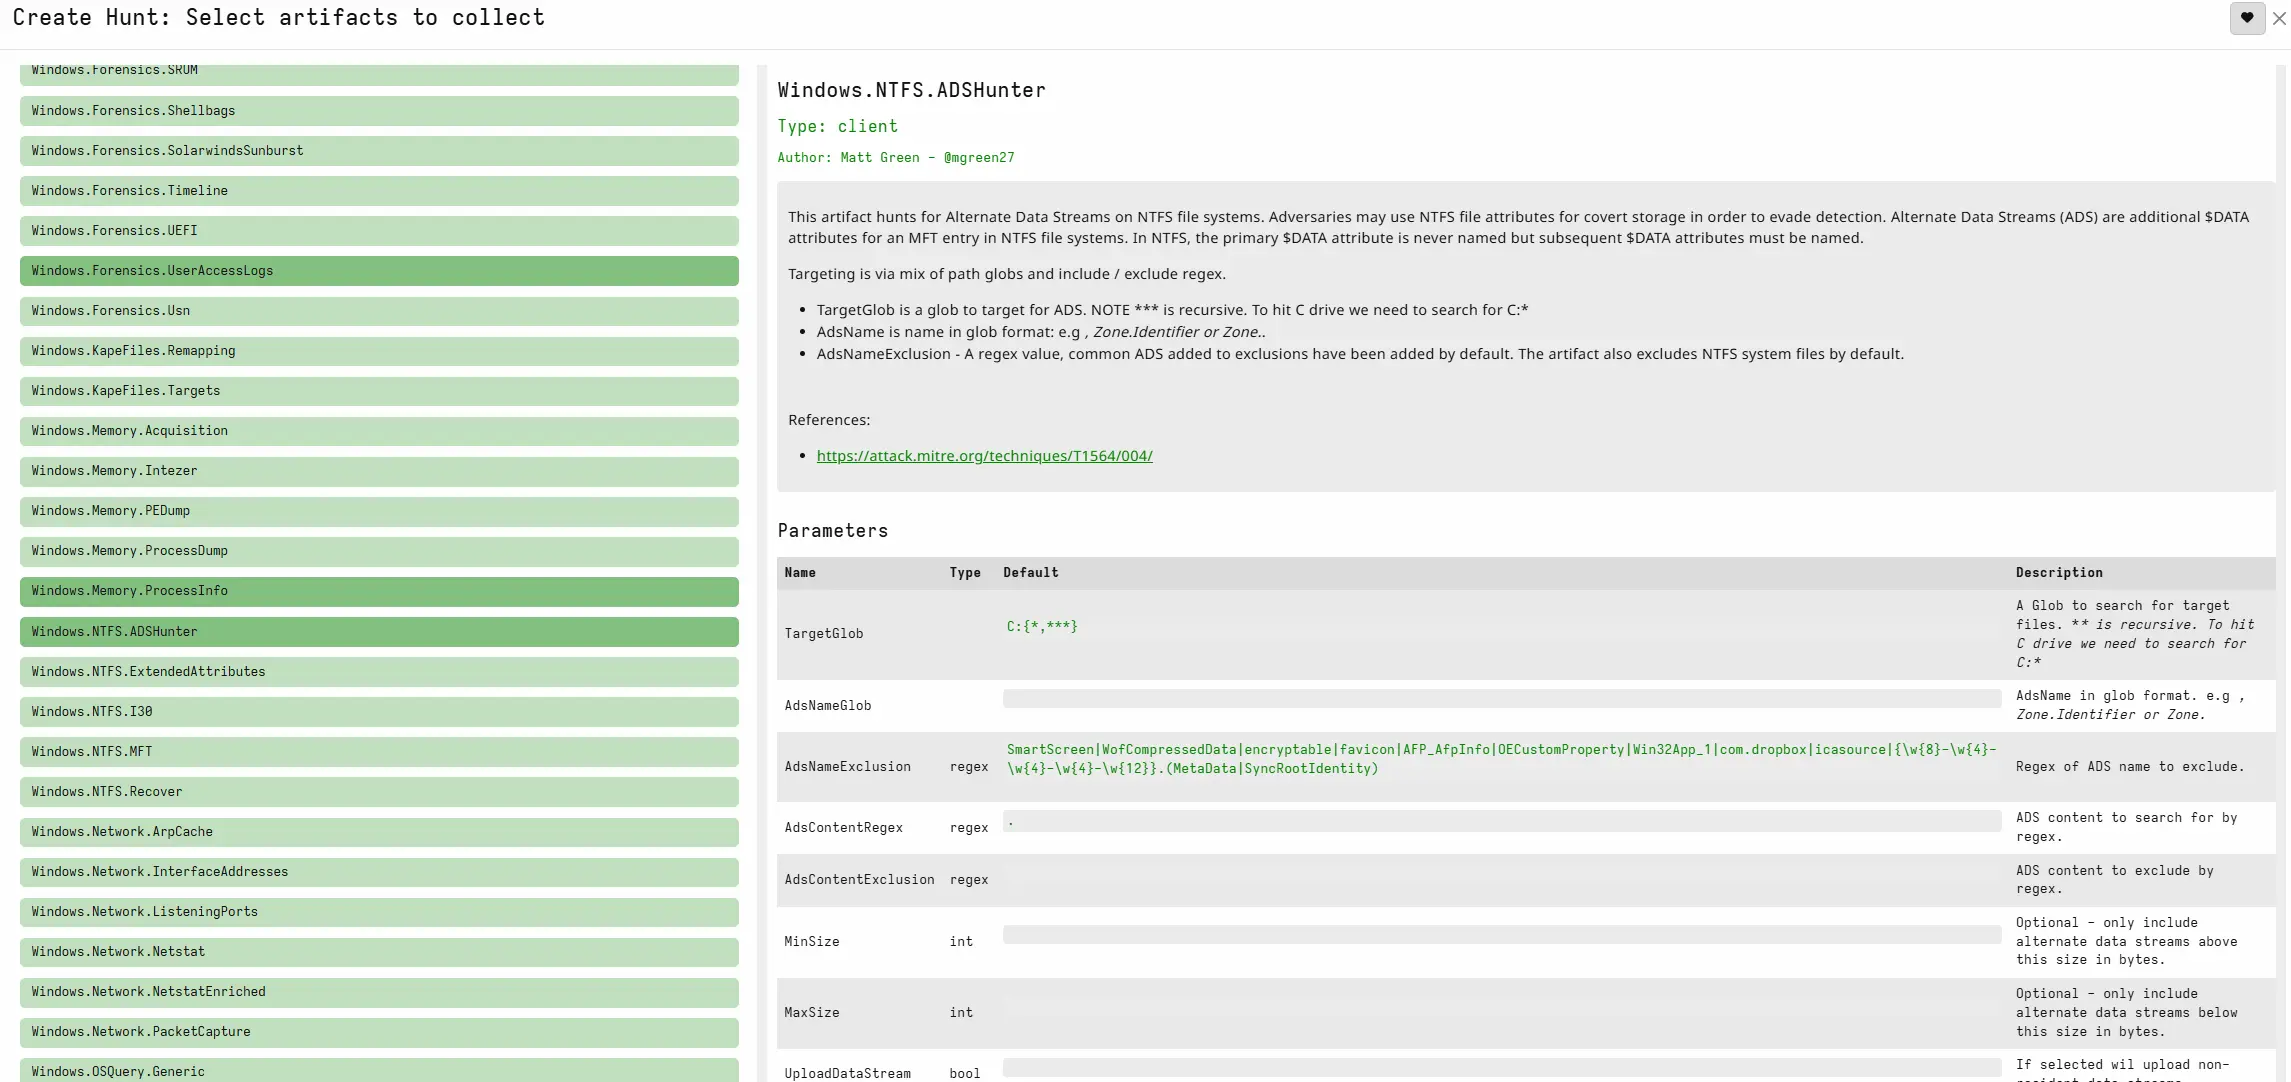
Alternate Data Streams (ADS) are a feature of the NTFS file system that allow data to be hidden within files without changing their visible size or appearance. Attackers use ADS to hide malware, scripts, or exfiltrated data. The ADS Hunter artifact scans for files with alternate data streams that could indicate malicious activity.
Incoming TeamViewer Connections
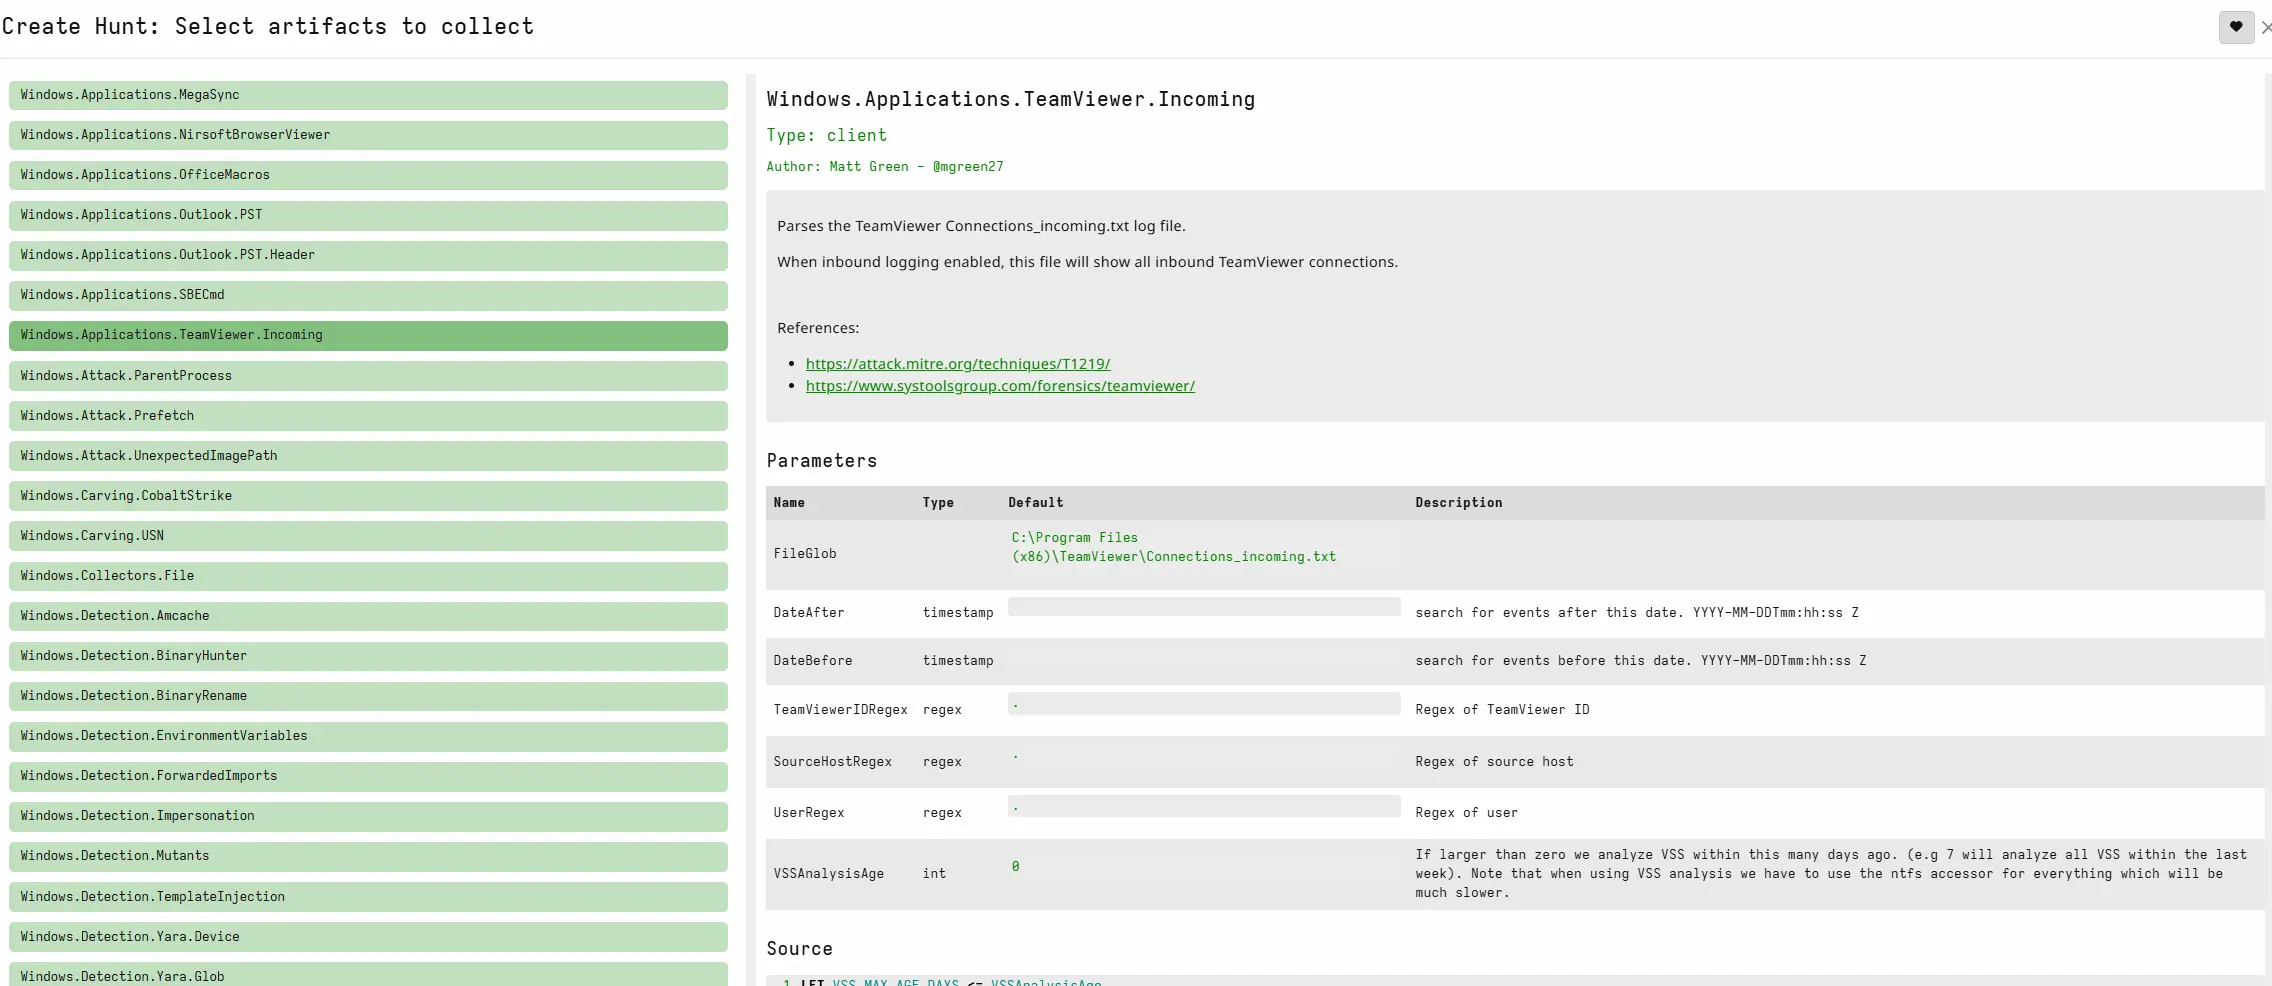
Remote access tools like TeamViewer are often used by attackers for persistence and remote control. This artifact checks for incoming TeamViewer connections to the endpoint. Unauthorized remote access tool usage is a red flag, especially if the organization does not use TeamViewer as part of normal operations.
Wrapping Up
Velociraptor gives you a tremendous amount of visibility into what is happening on an endpoint. From basic system info to detailed forensic artifacts, every piece of data an investigator needs is a few clicks away. The ability to deploy a collector, connect to endpoints, browse the file system, and run targeted artifact collections all from a central console makes incident response significantly faster and more thorough. The artifact library alone covers the majority of what you would normally need to check during an investigation, and if it does not have what you need, you can write your own with VQL.