Grafana
Data Visualization Platform
Grafana is an open-source analytics and interactive visualization platform that transforms metrics into meaningful insights.
Key Features
- Beautiful dashboards
- Multiple data source support
- Alerting capabilities
- Customizable visualizations
- Plugin ecosystem
Why I Use It
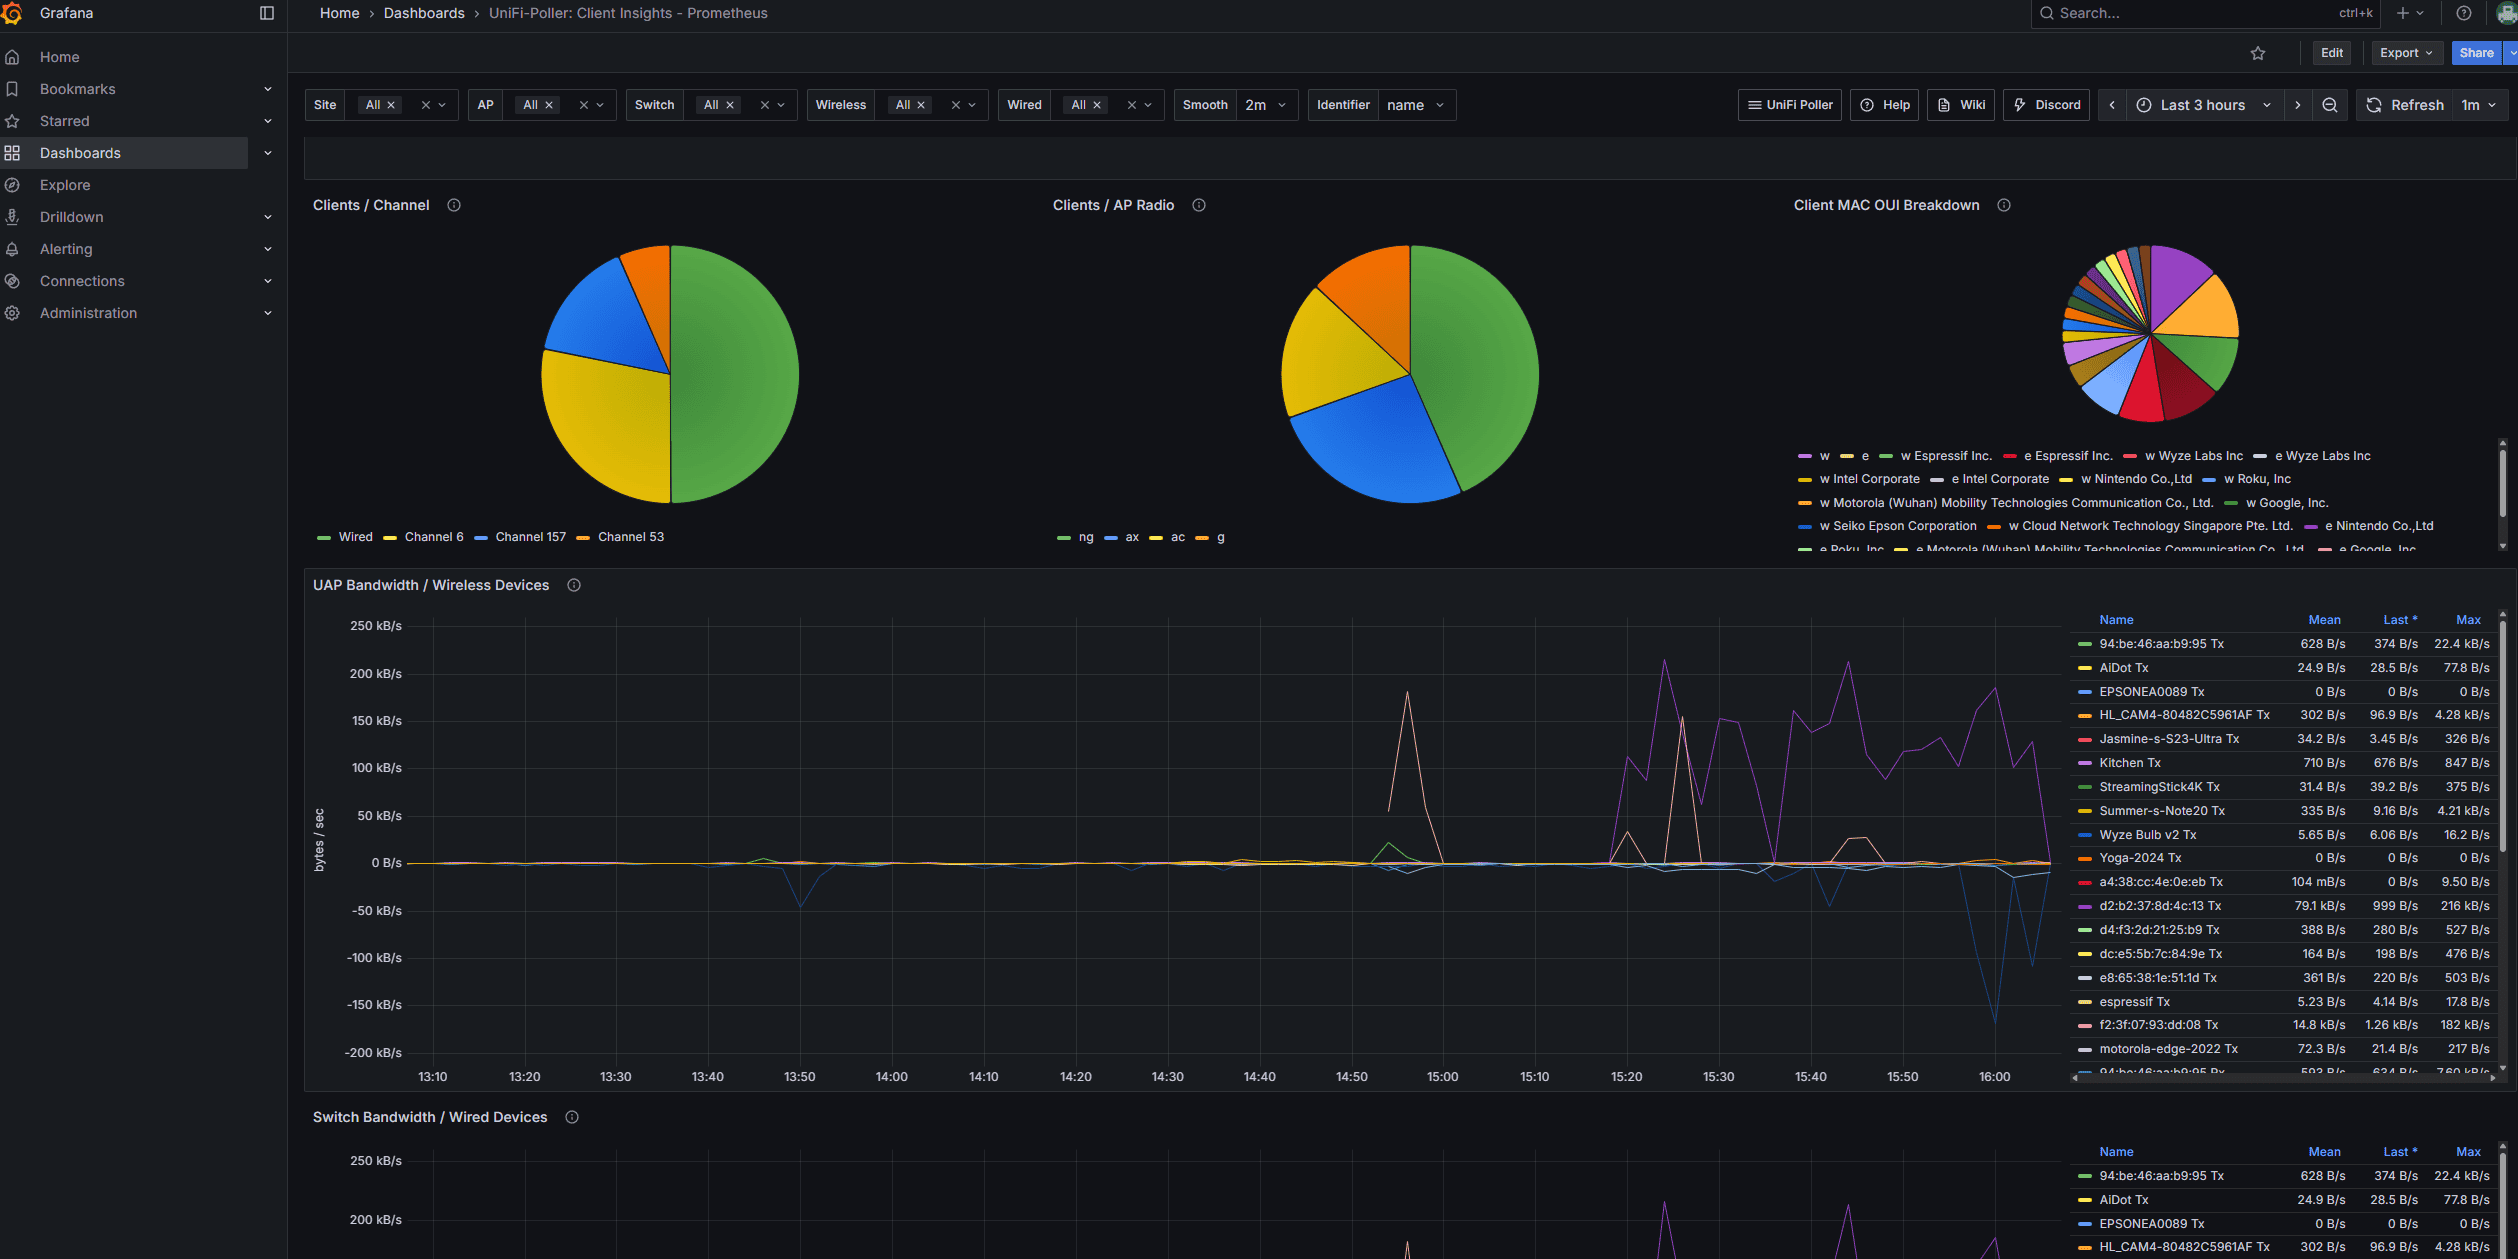
Grafana was the first monitoring service I ever set up, and it immediately hooked me on the idea of having full visibility into my infrastructure. I started simple — just keeping an eye on my Proxmox hypervisor — but over time the scope grew considerably. Today I have dashboards pulling in data from my UniFi access points and clients, Synology NAS, OPNsense firewall, and Windows Server, giving me a unified view of everything happening across my home lab. The real power of Grafana lies in how it connects to data sources: I use Prometheus for scraping real-time metrics from most of my systems and InfluxDB for time-series data where I need longer retention or a push-based model. Being able to mix and match these sources within a single dashboard is incredibly useful — I can correlate network traffic from OPNsense with CPU load on Proxmox all in one view. On top of that, Grafana’s customization options are hard to beat. From choosing panel types and color thresholds to writing custom PromQL or Flux queries, every dashboard can be tailored exactly to what I want to see. It has become the single pane of glass I reach for whenever I need to understand what’s going on in my environment.
Grafana also supports OIDC allowing my to add this to the services that I can login to with one account and without logging in, if I have a cookie from Authentik.
Links: GitHub · Official Site