Prometheus
Monitoring and Alerting
Prometheus is an open-source systems monitoring and alerting toolkit with a powerful query language and time-series database.
Key Features
- Multi-dimensional data model
- Powerful query language (PromQL)
- Time-series database
- Service discovery
- Alerting with Alertmanager
- Extensive exporters
Why I Use It
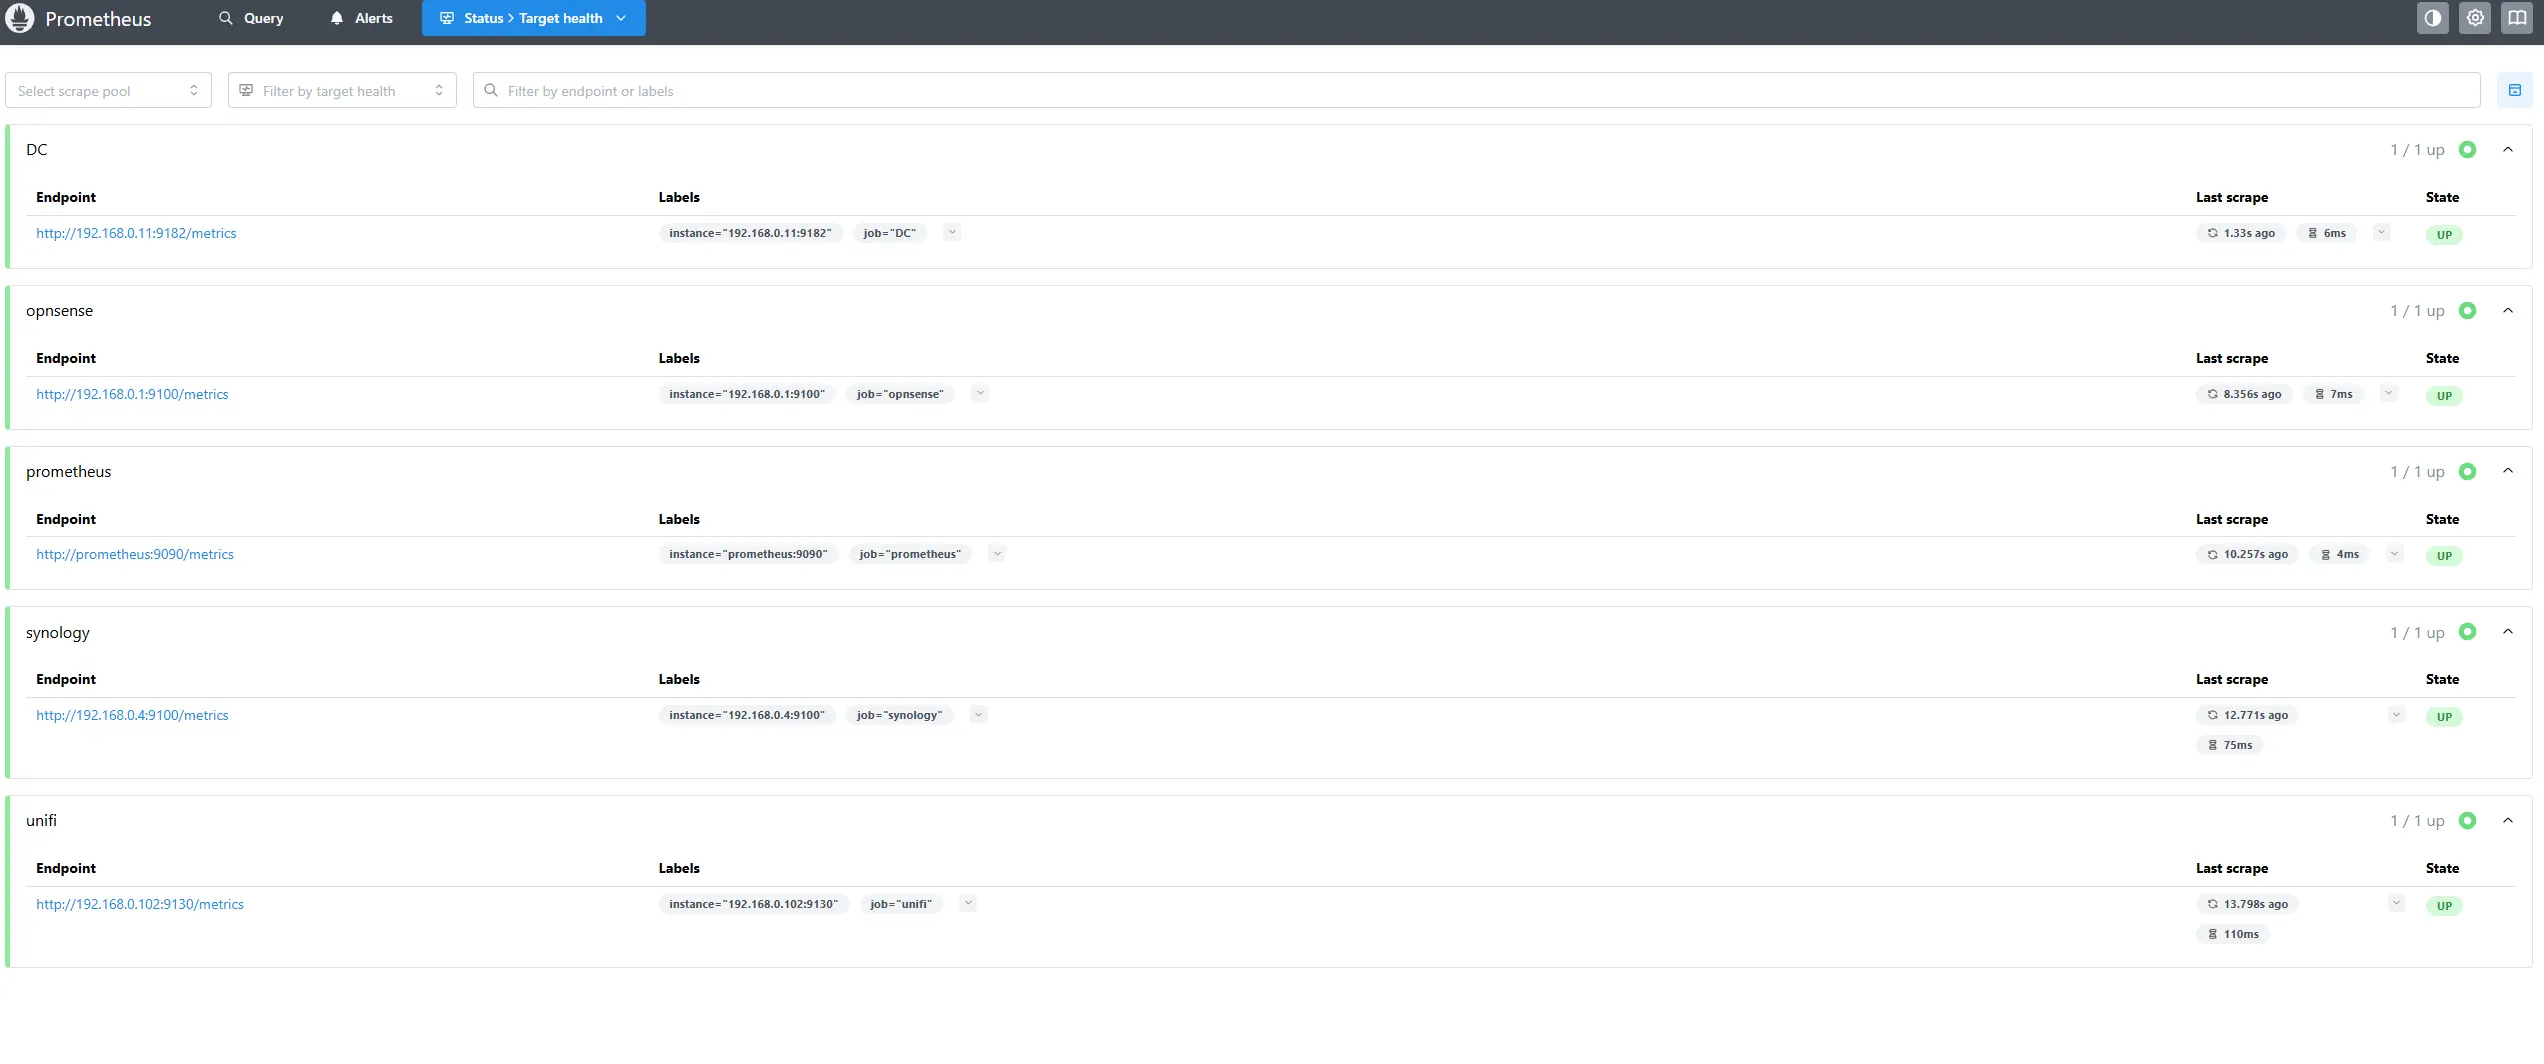
Prometheus is the metrics collection engine behind most of my Grafana dashboards. It scrapes exporters running on my systems — node exporters on Linux hosts, the Proxmox exporter, and application-specific exporters for various services — and stores all of that as time-series data that Grafana can query. The pull-based model means adding a new monitoring target is as simple as adding a scrape config and pointing at the right exporter. PromQL is powerful enough that I can build exactly the queries I need for custom dashboards rather than being limited to preset views.
Links: GitHub · Official Site