Pulse
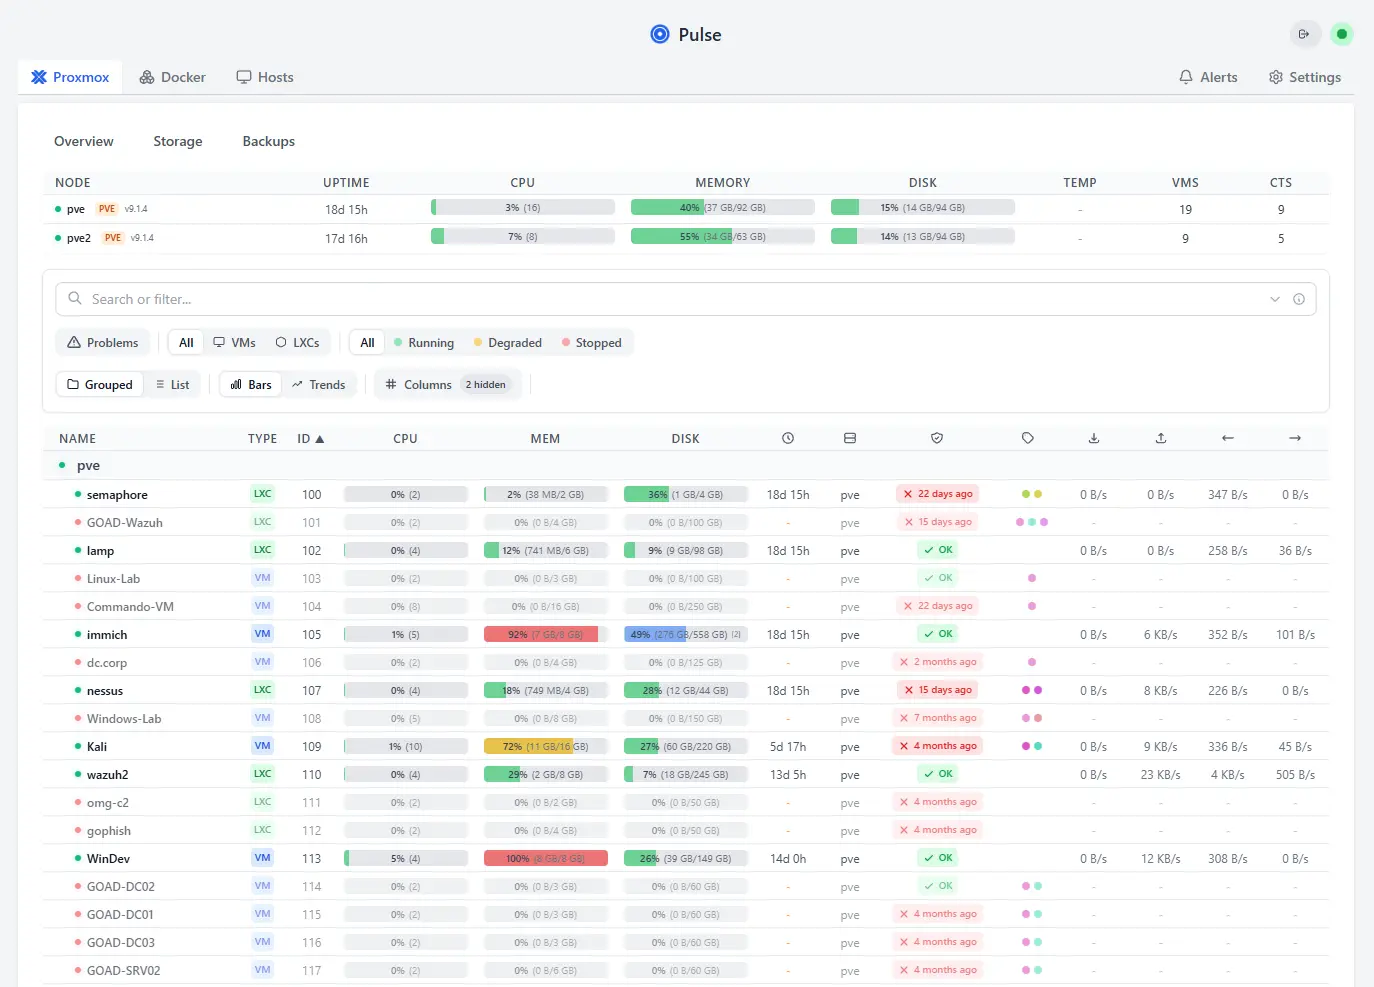
Server Monitoring Dashboard
Pulse is a simple and elegant server monitoring dashboard that provides real-time insights into your server’s health and performance.
Key Features
- Real-time server metrics
- Clean UI design
- Resource usage tracking
- Alert notifications
- Multi-server support
- Minimal resource footprint
Why I Use It
Pulse is what I use when I want a simple, immediate overview of server health without opening a full Grafana dashboard. It is minimal by design — CPU, memory, disk, and network at a glance — which makes it perfect for a quick sanity check or for displaying on a secondary screen. It does not replace deeper monitoring but it fills the gap between a full observability stack and having nothing at all visible at a moment’s notice.